GoldNuggets — Consolidation Mode
GoldNuggets Digest: Gold ETF allocations, gold holdings of ETFs, the 200-day average, gold fund flows, gold vs all other commodities...
The GoldNuggets Digest is our weekly publication. It contains “nuggets” of Charts & Research on gold, commodities, and macro —issues and insights which we think will be interesting and useful for investors.
Gold ETF Allocations
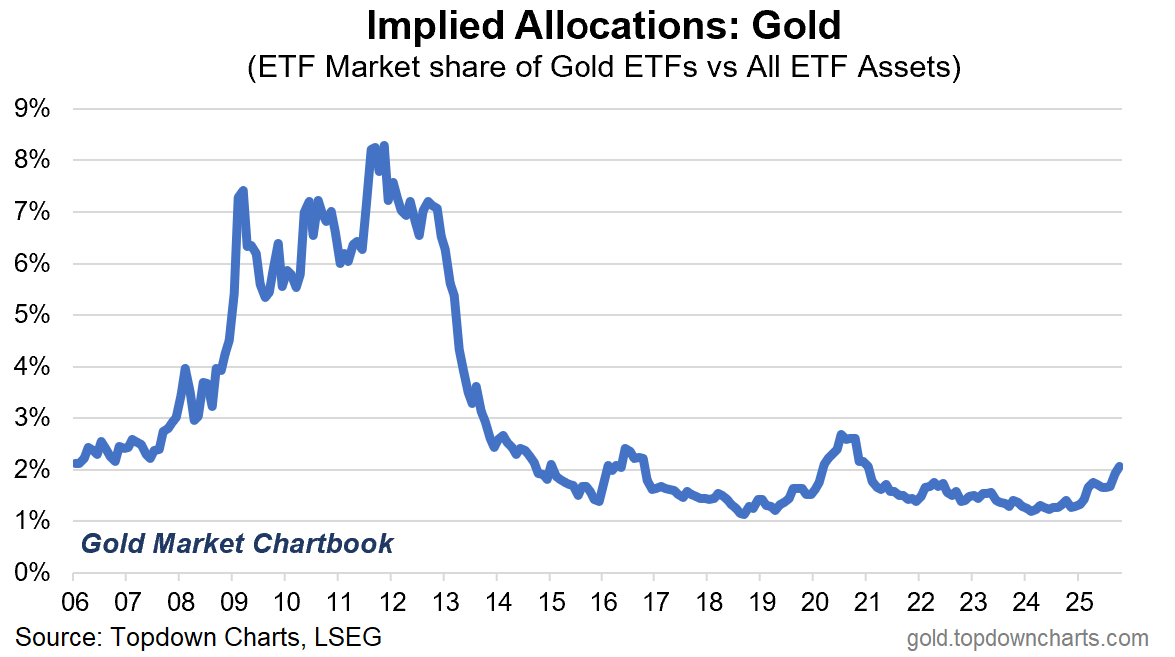
I shared a chart of total assets in gold ETFs the other day and noted that while most of the surge in AUM was market movements, there had been an uptick in flows. But I also wanted to update this, what you might call fuller picture, version which shows gold ETF assets as a percentage of all ETF assets (aka “implied allocations“).
The chart implies investors still have a relatively low allocation to gold ETFs — and even after the dream run gold has had, this indicator is still yet to eclipse the previous 2 high points.
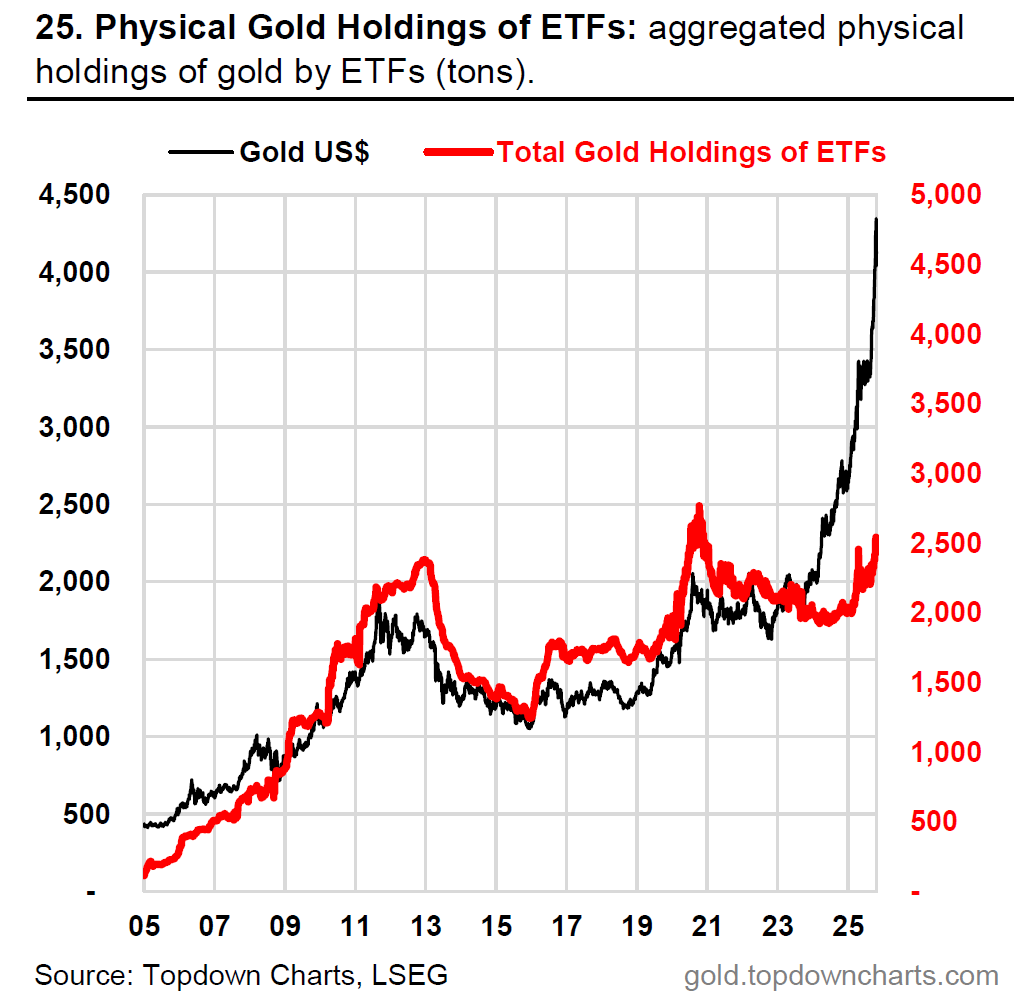
ETF Holdings of Gold
Another angle is looking at the total gold holdings of ETFs, and much as I mused above, there has indeed been an increase here — but similar to the previous chart, it’s still lower than where it got to in 2020. (source)
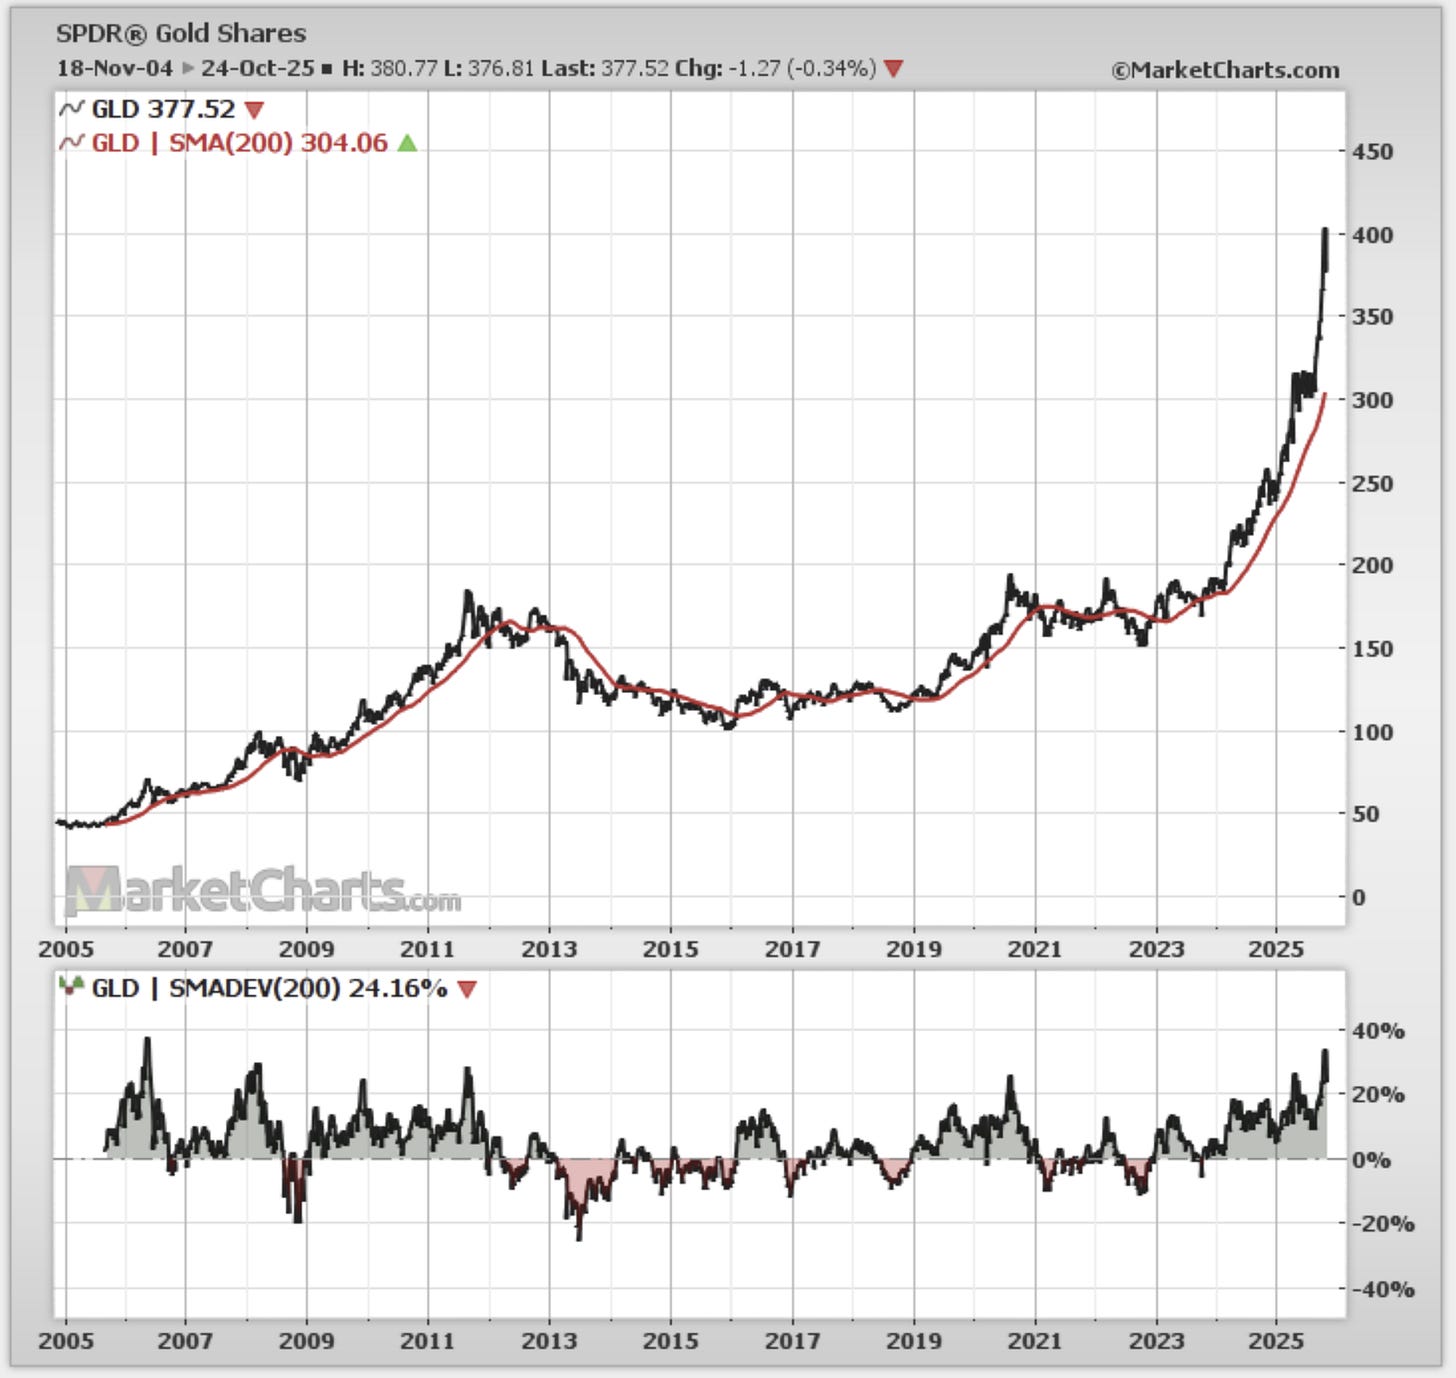
Deviation from 200-day Moving Average
Moving on to technicals, one observation worth highlighting is the deviation from 200-day moving average. From a basic technicals standpoint it’s generally a good thing if a market is above its 200-day average (a simple gauge of uptrend vs downtrend). (source)
But it has historically been problematic for gold when it goes too far too fast beyond its 200dma — we see several instances where this indicator goes above 20% in the chart below which ultimately resulted in a peak or period of consolidation. So it’s no surprise in that context to see a pullback/pause in gold.
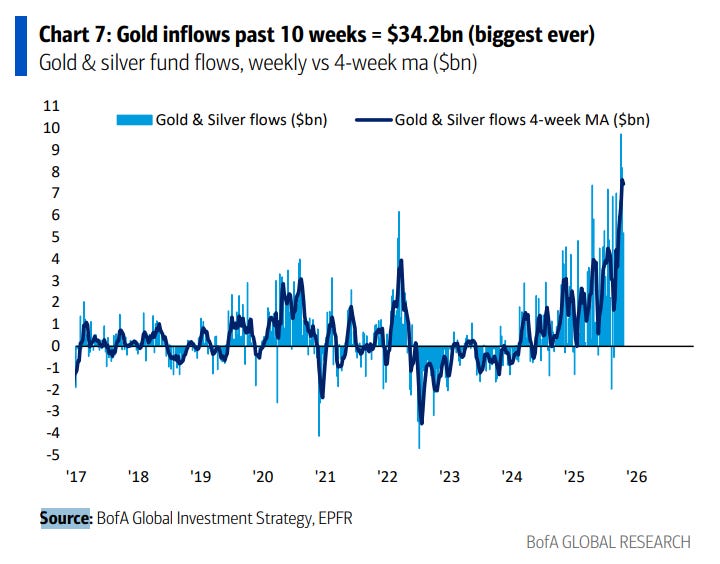
Flows Climax
On a similar note, we’ve seen a surge in investor interest in gold, as demonstrated by the record high flows into gold funds (and as another point of interest, there was a record high surge in gold call options). (source)
It all adds up to gold finally starting to see some speculative interest and flows-frenzy; and again it’s only natural to see periods of consolidation following such conditions as markets digest the excesses and buyer/seller activity balance out.
Gold vs all other Commodities
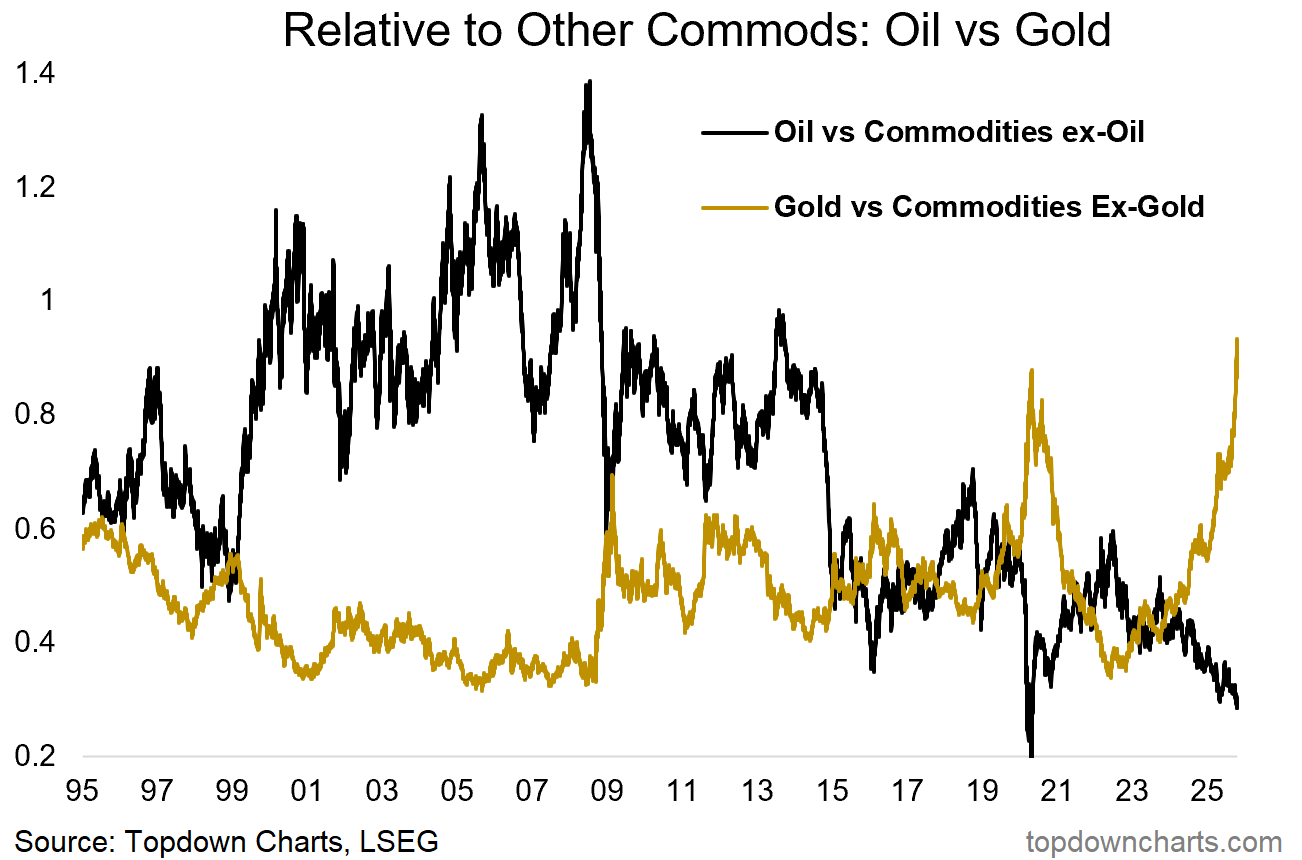
Lastly, I updated this chart the other day when talking about the potential upside in crude oil; which by contrast is a much-hated commodity by most investors at the moment. (source)
On first glance of this chart you might be tempted to say that crude oil looks cheap and due for a bounce, and gold looks stretched (and that all other commodities may need to start pulling their weight!).
Either way, it’s always interesting to see extremes like these emerging, as that’s where some of the best opportunities and biggest risks are born…
This note was brought to you by the Monthly Gold Market Chartbook
About the Monthly Gold Market Chartbook
The monthly Gold Market Chartbook is specifically designed to help busy investors quickly + easily understand the key drivers of risk vs opportunity in the gold market (and how it fits into traditional portfolios).
The pack includes over 70 charts, specialized indicators, and unique data, spanning:
Sentiment/Flows/Positioning (where are the pressures building up?)
Technicals, Global Gold Price (momentum, trend, divergences)
Long-term & Valuation Indicators (is gold overvalued?)
Gold Influences: Monetary & Macro (monetary tailwinds in play)
Gold Influences: Supply & Demand (supply vs demand outlook)
Gold Priced in other Currencies (what’s gold doing elsewhere?)
Gold Price Ratios (how is gold performing vs other assets?)
Asset Allocation Perspectives on Gold (how does gold fit in portfolios?)
Asset Watch: Stocks/Bonds/USD/Credit (risks vs opportunities in other major asset classes — and how that compares vs gold)
Silver Charts Section: sentiment, positioning, flows, valuations (i.e. how is the outlook for silver prices?)
NEW: Gold Miners: valuations, flows, allocations, fundamentals (i.e. what’s the risk/return setup for Gold Mining stocks?)
NEW: Other Precious Metals (Platinum & Palladium charts)
Act Now — (if you’re not already a subscriber), sign up to get instant access to the latest chartbook + archives; level-up your understanding and visibility on the key risks & opportunities in gold and precious metals investing.
If you have any questions/suggestions about the material or requests, simply get in touch via the website, we’d love to hear your thoughts.
Best wishes,
Callum Thomas
Head of Research & Founder
Topdown Charts | www.topdowncharts.com
LinkedIn: https://www.linkedin.com/in/callum-thomas-4990063/
NEW: Other services by Topdown Charts
Topdown Charts Entry-Level — [TD entry-level service]
Topdown Charts Professional — [institutional service]
Weekly S&P 500 ChartStorm —[US Equities in focus]
Monthly Gold Market Pack — [Gold charts]
Australian Market Valuation Book —[Aussie markets]


Really appreciate the consolidation perspective here. Your point about gold being >20% above the 200dma (historically leading to pullbacks) is a healthy reminder that even in strong bull markets, periodic digestion is normal and necesary. What's interesting from a gold miner perspective is that companies like Gold Fields have actually benefited from this consolidation phase. During pullbacks, quality operators with strong balance sheets and improving cost structures tend to hold up better relative to marginal producers. Gold Fields' geographic diversification (Ghana's Tarkwa, Australia's Granny Smith/Gruyere, Chile's Salares Norte) provides operational stability during volatile gold price periods. Your observation about ETF flows reaching climax levels is particularly relevant for GDX constituents. When speculative interest surges as you documented, miners often get bid up beyond fundamentals. A consolidation allows valuations to reset while production and cash flow continue building. With Gold Fields maintaining AISC around $1,300-1,400/oz and gold consolidating in the $3,200-3,400 range, the fundamental earnings picture remains extremely strong even as momentum traders rotate. Looking forward to your new Gold Miners section - that fundamental analysis will be valuable for separating quality from hype!