
GoldNuggets — Crude & Base
GoldNuggets Digest: gold vs other metals, copper/gold ratio, oil/gold ratio, crude oil price outlook, oz of gold to buy a new house...

The GoldNuggets Digest is our weekly publication. It contains “nuggets” of Charts & Research on gold, commodities, and macro —issues and insights which we think will be interesting and useful for investors.
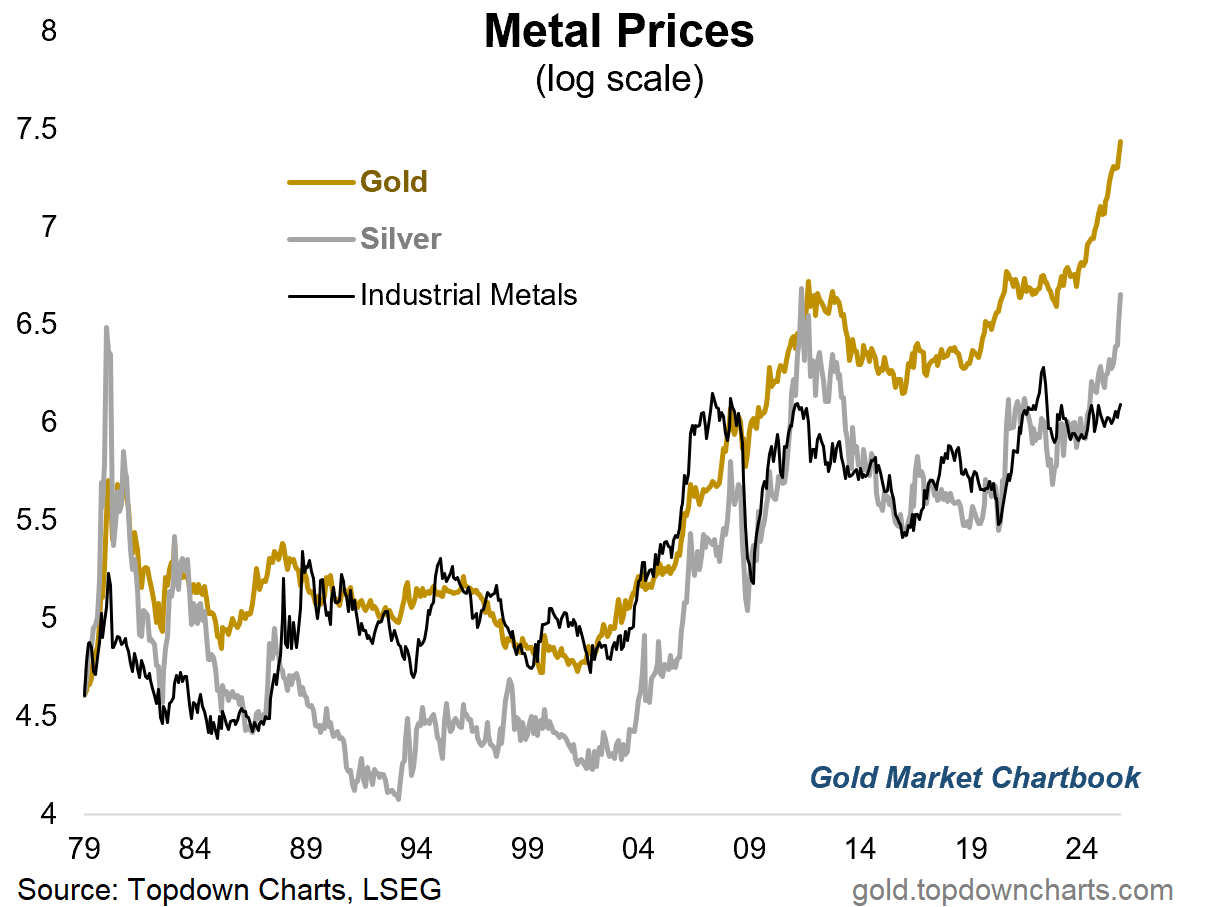
Metal Price Procession
Continuing with the theme of recent editions, this chart shows the price procession across metals, with gold being the most pure monetary metal; silver being partly a monetary metal and partly an industrial metal; and industrial metals being metals of industry.
The key distinction is that monetary metals are driven more by monetary factors; fiscal issues, central bank operations, fiat flows, and things of that nature. While industrial metals are more driven by real economic activity (along with swings in supply, and other issues).
The economic logic in the linkages or echoes across these metals is that you can see gold getting bolstered by fiscal largesse and monetary easing; which ultimately flows through into economic activity and greater demand for base metals (and higher prices).
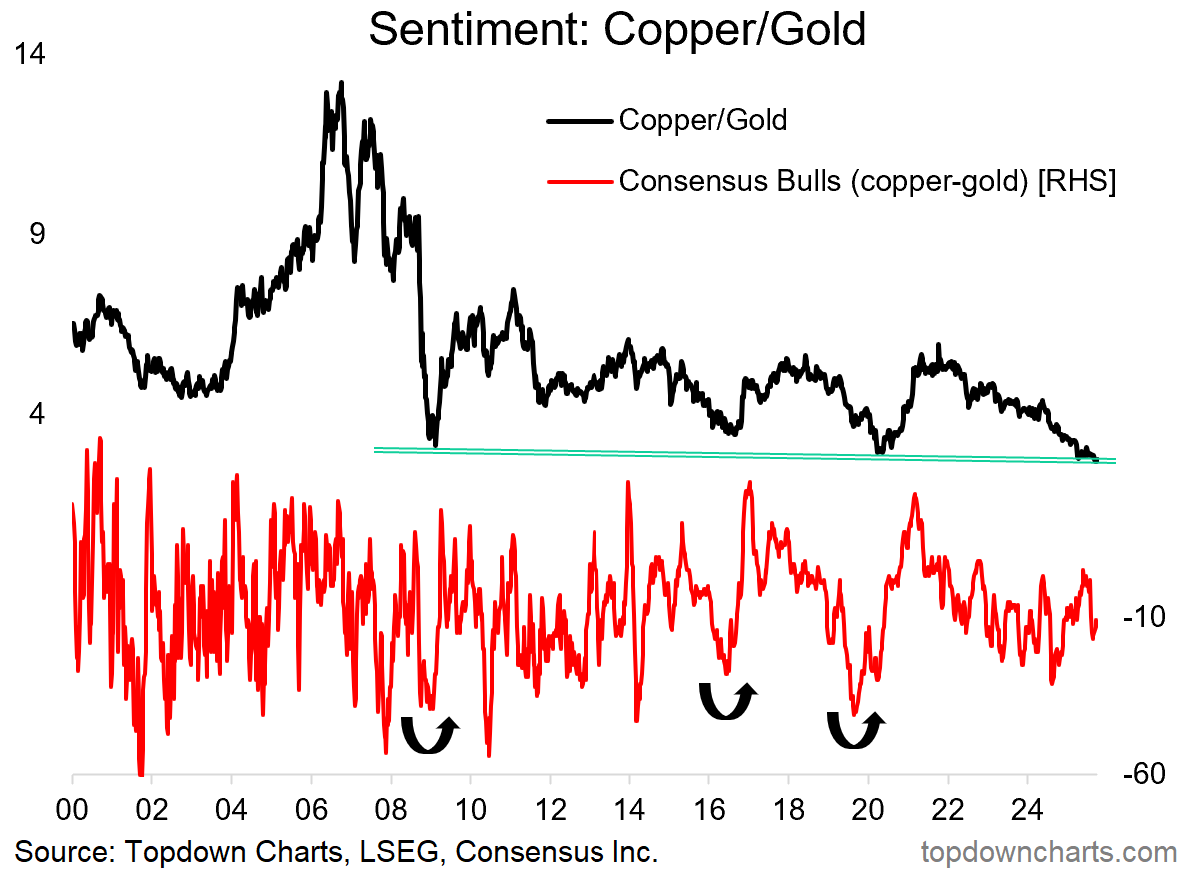
Copper vs Gold Ratio
On a similar note, here’s the copper/gold ratio meandering along its long-term major support level. I think odds are good we rally off this level partly from a technical standpoint given the moves in relative sentiment (bullish divergence).
But also because my base case is we see improved economic activity into 2026, and copper enjoys multiple thematic + cyclical tailwinds… meanwhile the run in gold has been fast and furious, and again I reckon it’s high time for catch-up by the rest of commodities.
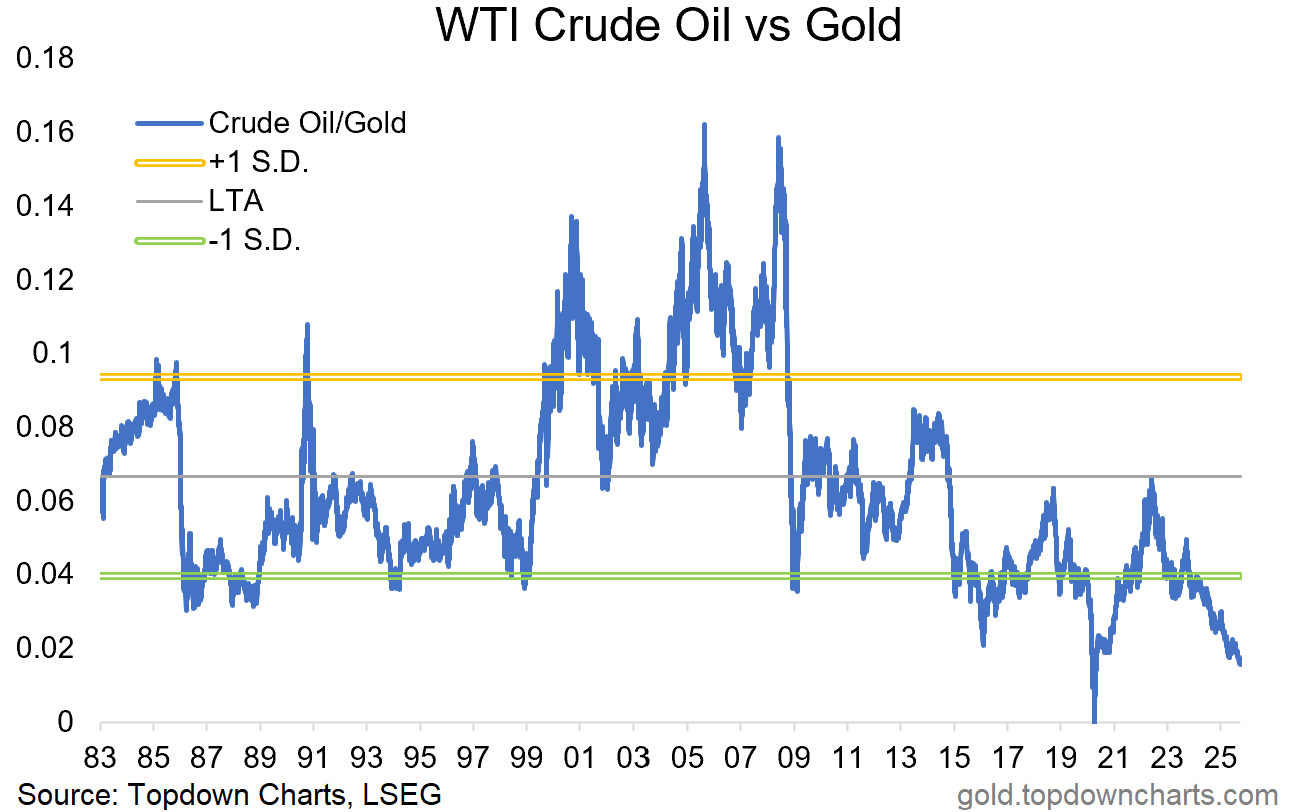
Oil vs Gold Ratio
Which brings us to the oil vs gold ratio — which has plunged to its second lowest reading in recent recorded history.
One way to look at this is to say that oil looks cheap vs gold.
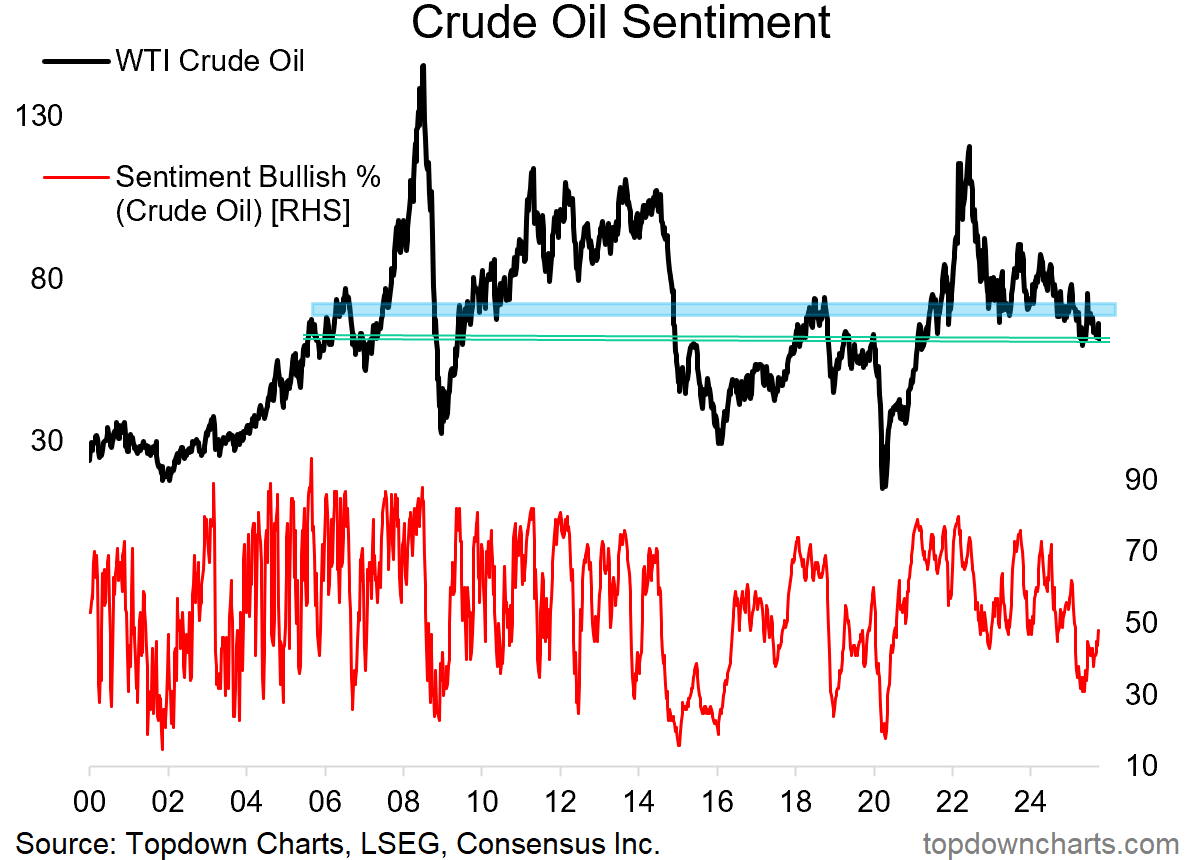
Checking in on Crude Oil
But if you’re sitting there about to tell me how bad things are for crude, I understand. Supply has been beating demand lately on the crude oil front, I will admit that (I mean, it barely rallied through the unprecedented Israel/US-Iran conflict earlier this year, and seems unphased by the US military build-up around Venezuela).
In the end, I think this chart is helpful in setting the lines in the sand: so far crude has managed to hold onto that major lower support level, with neither bulls nor bears able to get it out of the range trade… so I’d say when we break (either way) on this it’s going to be big.
My bias is higher, and the sentiment pattern below (and my macro outlook) is supportive of that, but let’s see what happens.
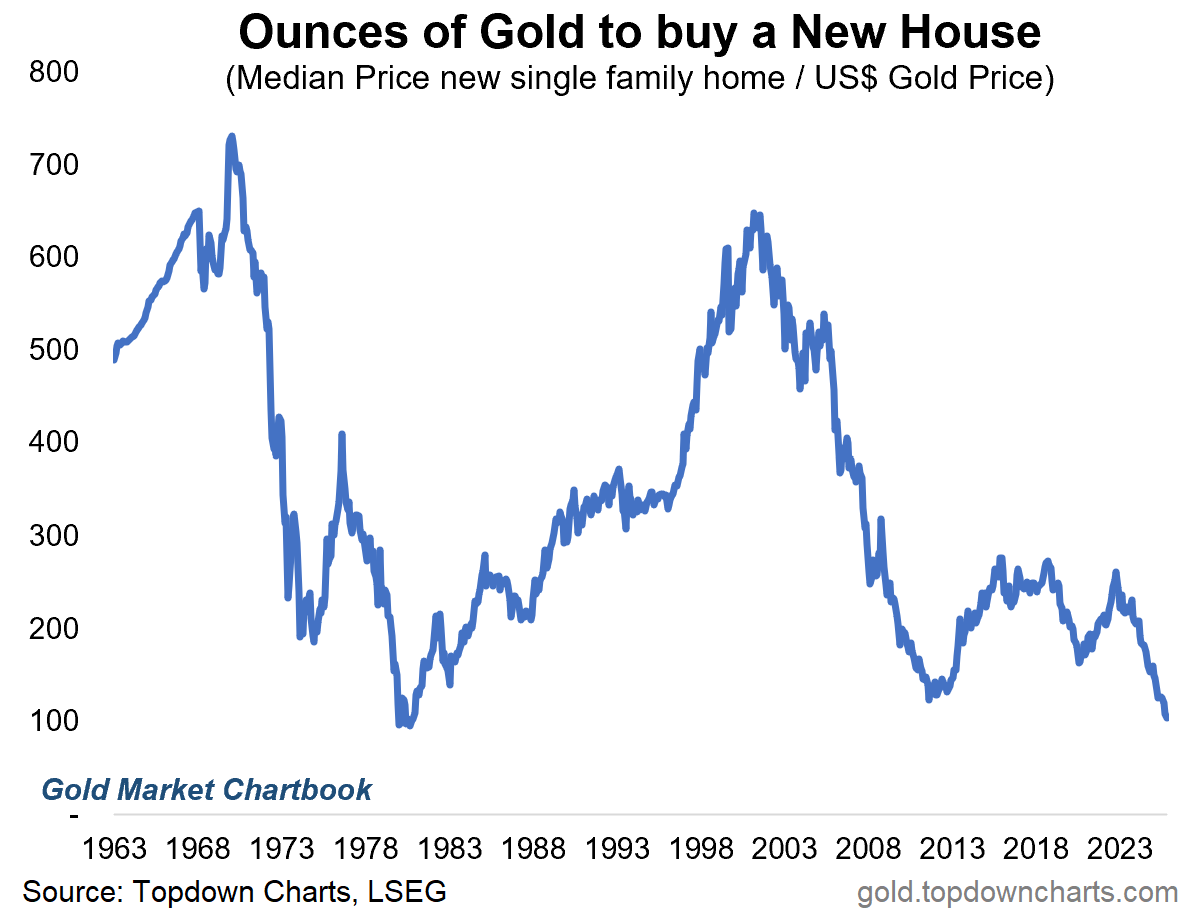
Housing Priced in Gold
Lastly, a bit of fun with charts — the ounces of gold required to buy a new house in the USA is approaching record lows (thanks mostly to soaring gold prices, but also lackluster housing).
In other words, houses are extremely cheap when priced in gold(!)
This note was brought to you by the Monthly Gold Market Chartbook
About the Monthly Gold Market Chartbook
The monthly Gold Market Chartbook is specifically designed to help busy investors quickly + easily understand the key drivers of risk vs opportunity in the gold market (and how it fits into traditional portfolios).
The pack includes over 70 charts, specialized indicators, and unique data, spanning:
Sentiment/Flows/Positioning (where are the pressures building up?)
Technicals, Global Gold Price (momentum, trend, divergences)
Long-term & Valuation Indicators (is gold overvalued?)
Gold Influences: Monetary & Macro (monetary tailwinds in play)
Gold Influences: Supply & Demand (supply vs demand outlook)
Gold Priced in other Currencies (what’s gold doing elsewhere?)
Gold Price Ratios (how is gold performing vs other assets?)
Asset Allocation Perspectives on Gold (how does gold fit in portfolios?)
Asset Watch: Stocks/Bonds/USD/Credit (risks vs opportunities in other major asset classes — and how that compares vs gold)
Silver Charts Section: sentiment, positioning, flows, valuations (i.e. how is the outlook for silver prices?)
NEW: Gold Miners: valuations, flows, allocations, fundamentals (i.e. what’s the risk/return setup for Gold Mining stocks?)
NEW: Other Precious Metals (Platinum & Palladium charts)
Act Now — (if you’re not already a subscriber), sign up to get instant access to the latest chartbook + archives; level-up your understanding and visibility on the key risks & opportunities in gold and precious metals investing.
If you have any questions/suggestions about the material or requests, simply get in touch via the website, we’d love to hear your thoughts.
Best wishes,
Callum Thomas
Head of Research & Founder
Topdown Charts | www.topdowncharts.com
LinkedIn: https://www.linkedin.com/in/callum-thomas-4990063/
NEW: Other services by Topdown Charts
Topdown Charts Entry-Level — [TD entry-level service]
Topdown Charts Professional — [institutional service]
Weekly S&P 500 ChartStorm —[US Equities in focus]
Monthly Gold Market Pack — [Gold charts]
Australian Market Valuation Book —[Aussie markets]