GoldNuggets — Gold Price Puzzle
GoldNuggets Digest: global gold price index, gold price seasonality, gold price consolidations, gold mining stock technicals, China gold demand...
The GoldNuggets Digest is our weekly publication. It contains "nuggets" of Charts & Research on gold, commodities, and macro —which we think will be interesting and useful for investors.
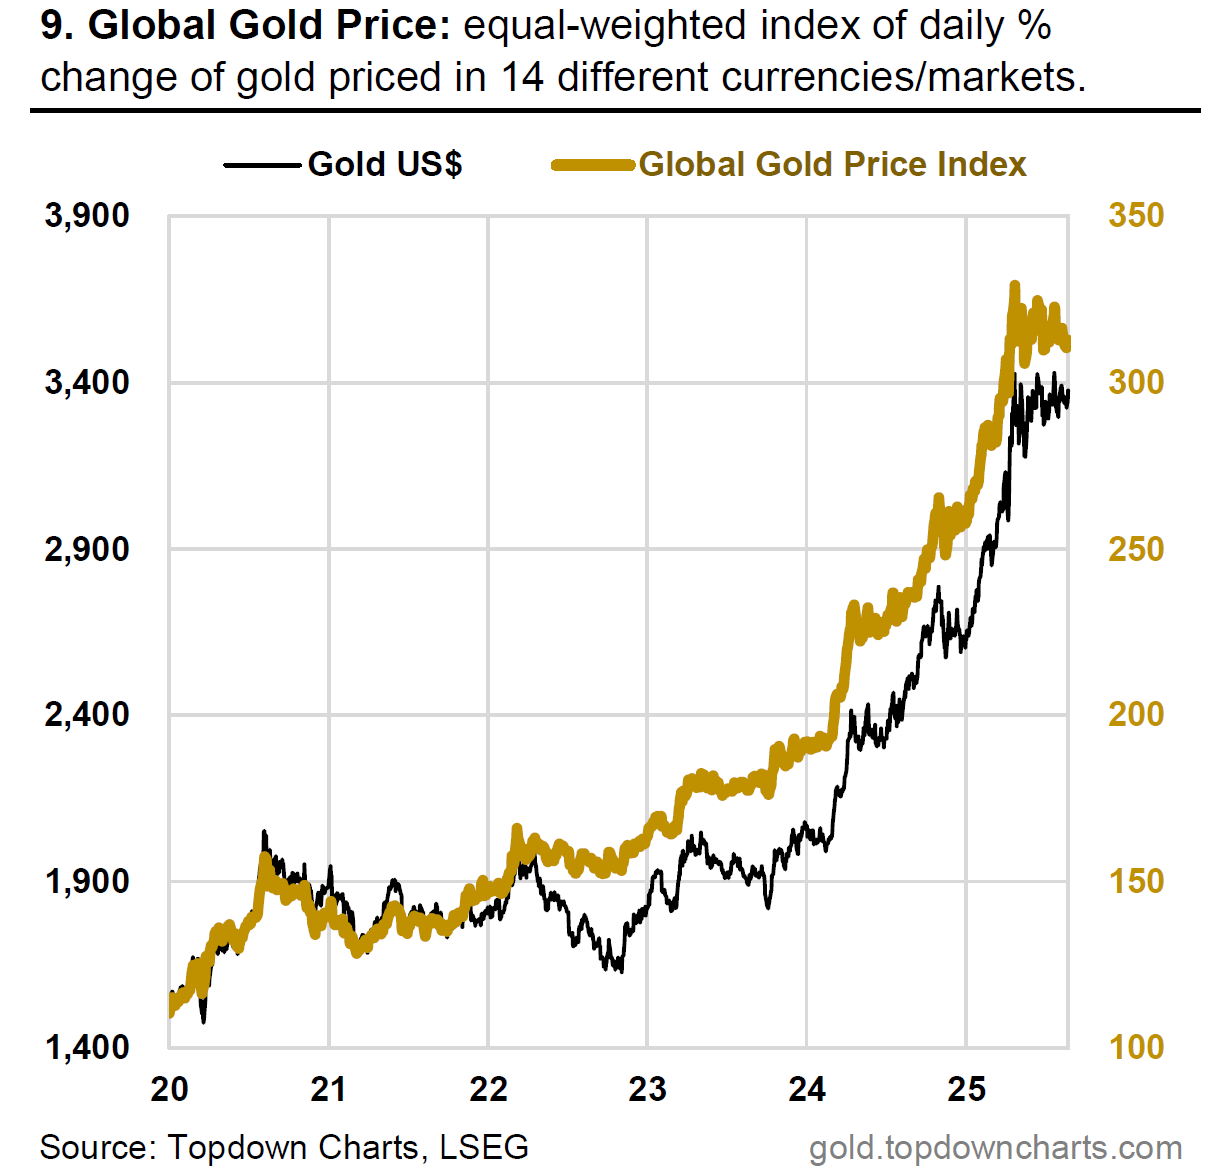
Global Gold Price
While the US$ gold price appears to be trading in an ascending triangle pattern (which tends to have a bullish skew to resolutions; breaks higher more often than down), the Global Gold Price Index is looking more like a symmetrical triangle (could go either way) …and if anything more recently looks like a descending triangle.
I recommend keeping a close eye on gold in the coming weeks because while it could just keep ranging, a breakout (either way) is going to set the tone for the rest of the year and probably into next year too for that matter…
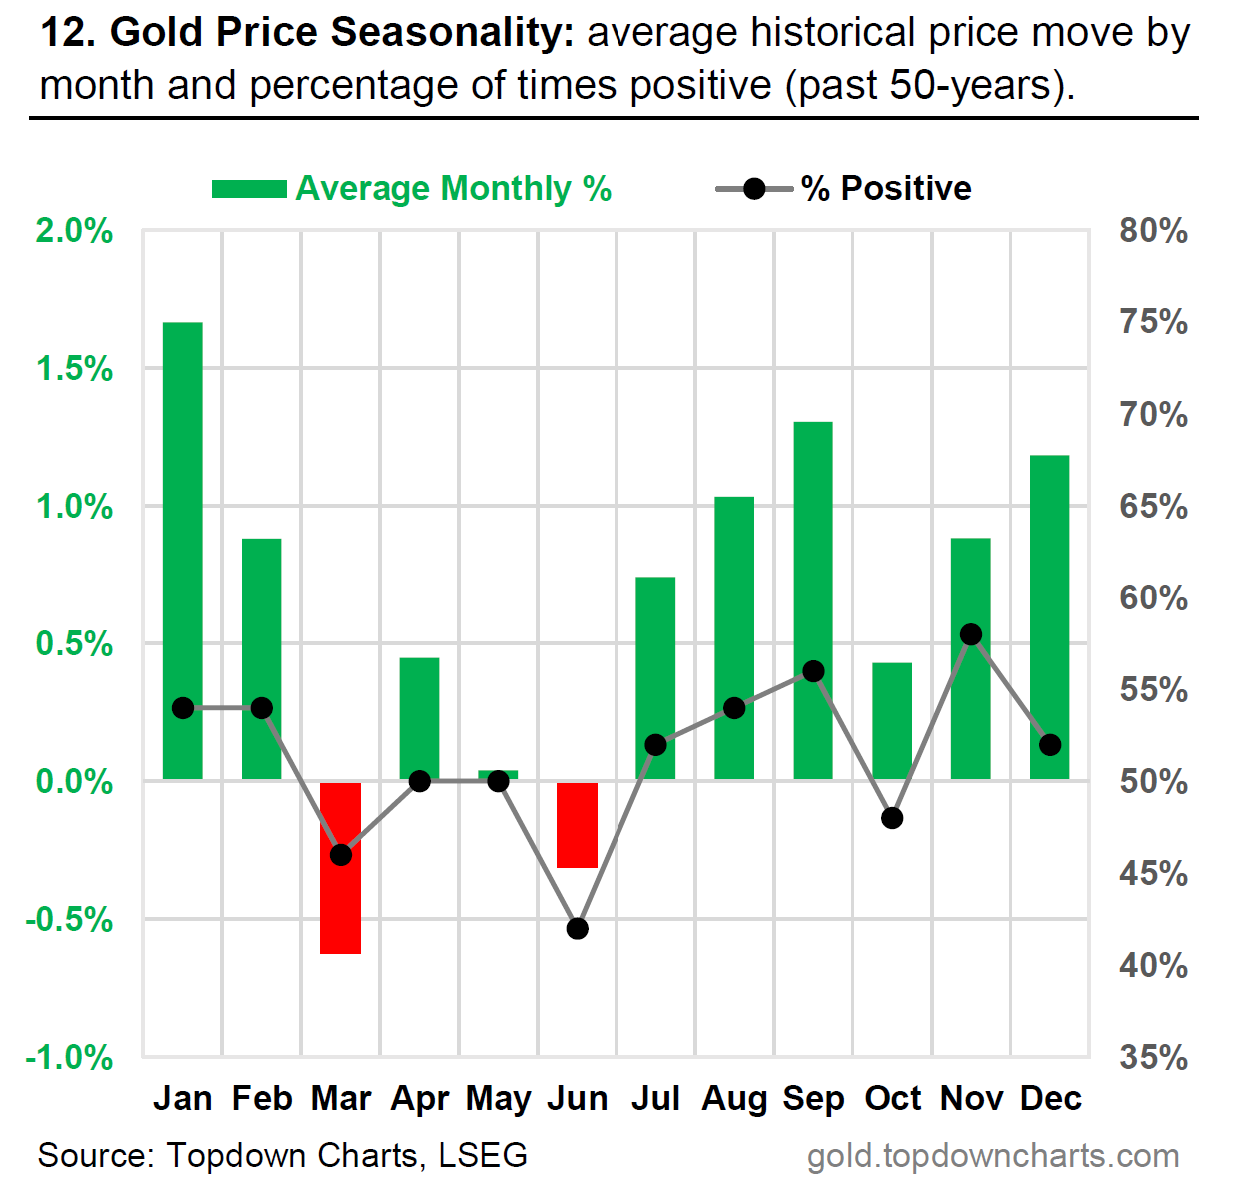
September Seasonality
As I’ve been highlighting over on the Weekly ChartStorm, while the stockmarket has some of its worst seasonal performance around September, it’s the opposite for gold —September has historically been the second best month of the year for the US$ gold price in terms of average return and probability of gains.
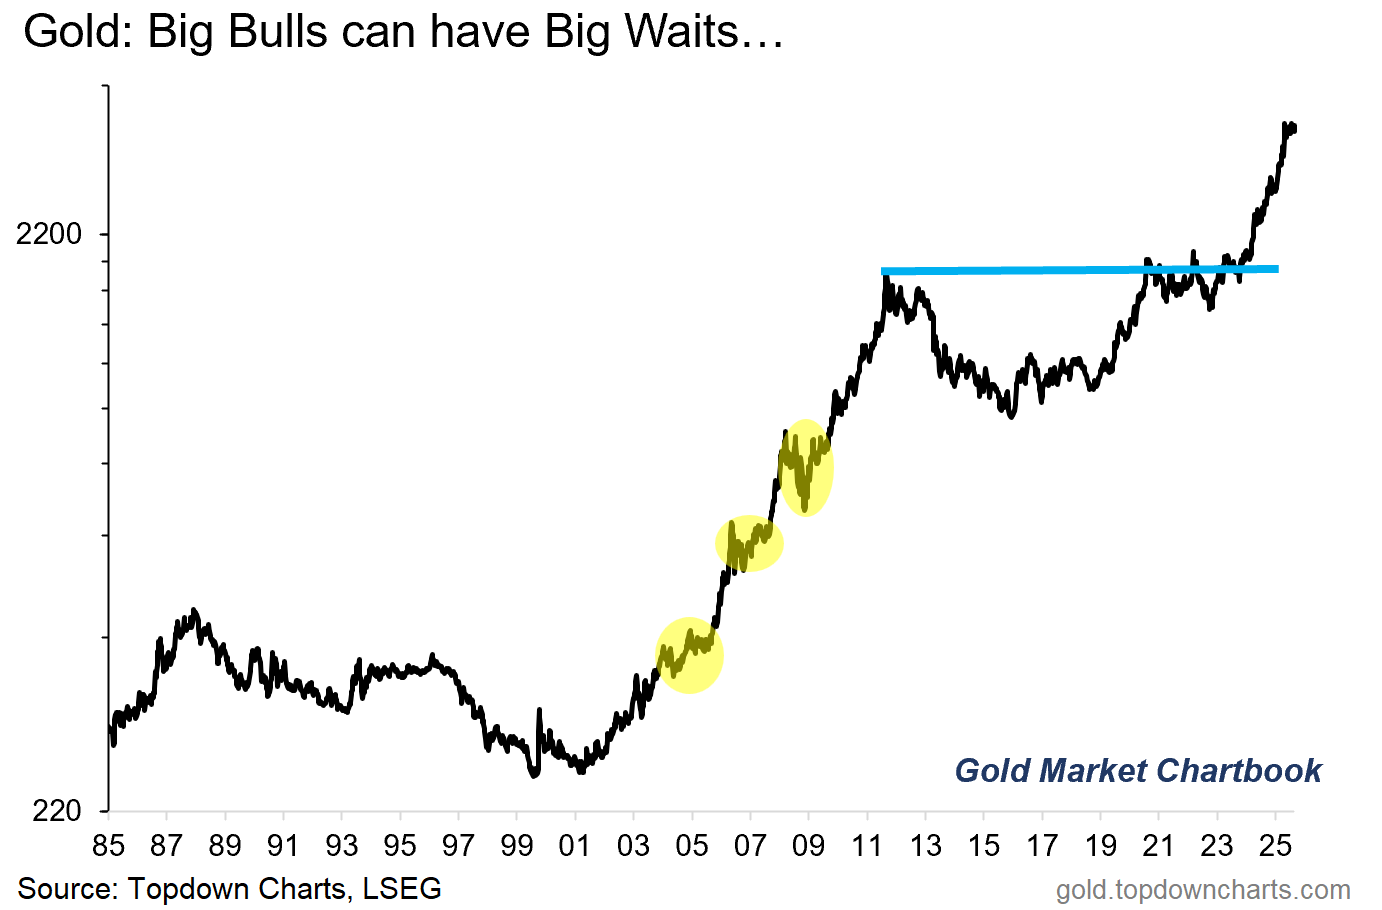
Big Bulls and Big Ranges
While the current consolidation in gold has been going on for 5 months so far, it’s worth keeping in perspective that the last big bull market in gold featured 3 major periods of consolidation lasting 12-18 months.
So even if we do range-trade-for-longer, it doesn’t necessarily mean an end to the bull market, and in fact might be quite a normal feature.
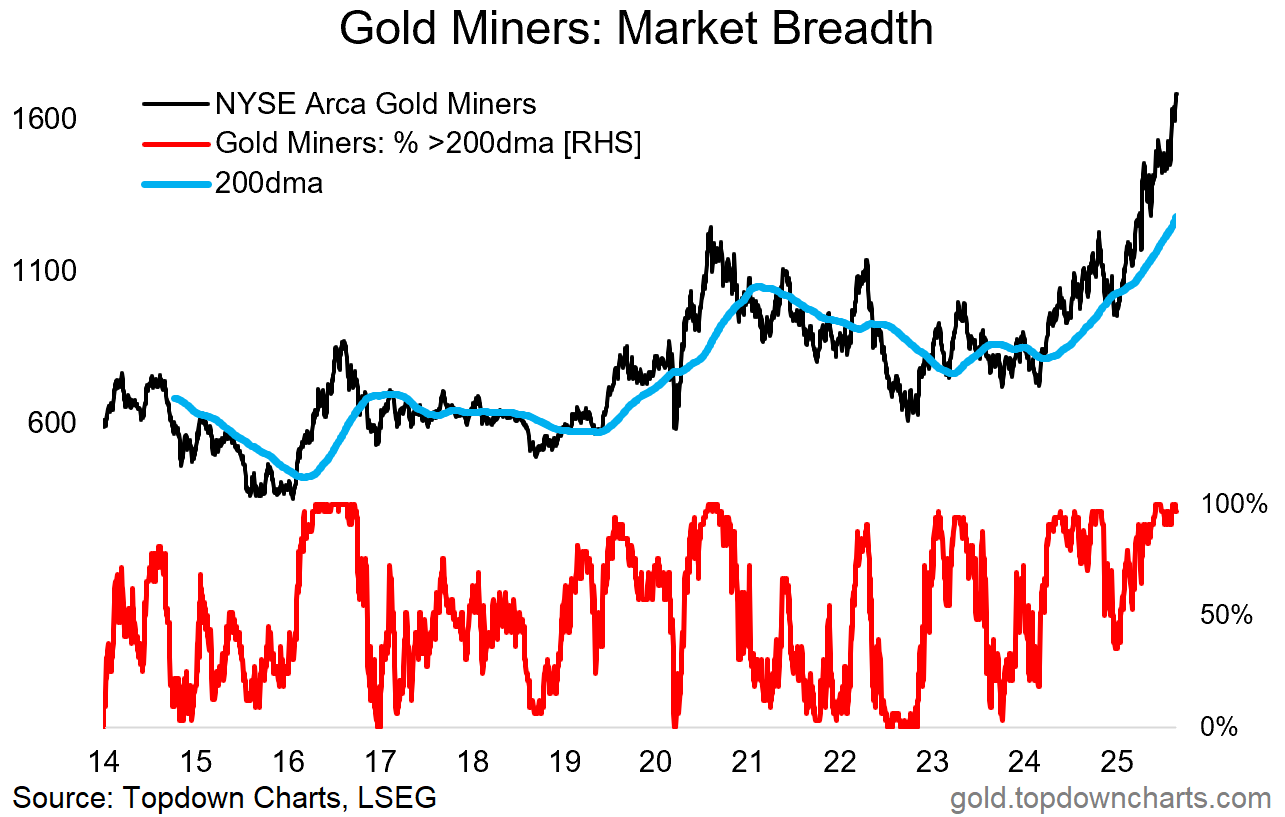
Gold Miners
One good thing about higher for longer gold prices, even if we are stuck in consolidation mode, is that it means higher profits for gold miners and those holding gold mining stocks.
And indeed, it’s a picture of strength for gold miners with the index making higher highs, comfortably above its upward-sloping 200-day moving average, and breadth running about as strong as it gets.
China Gold Buy—/Bye?
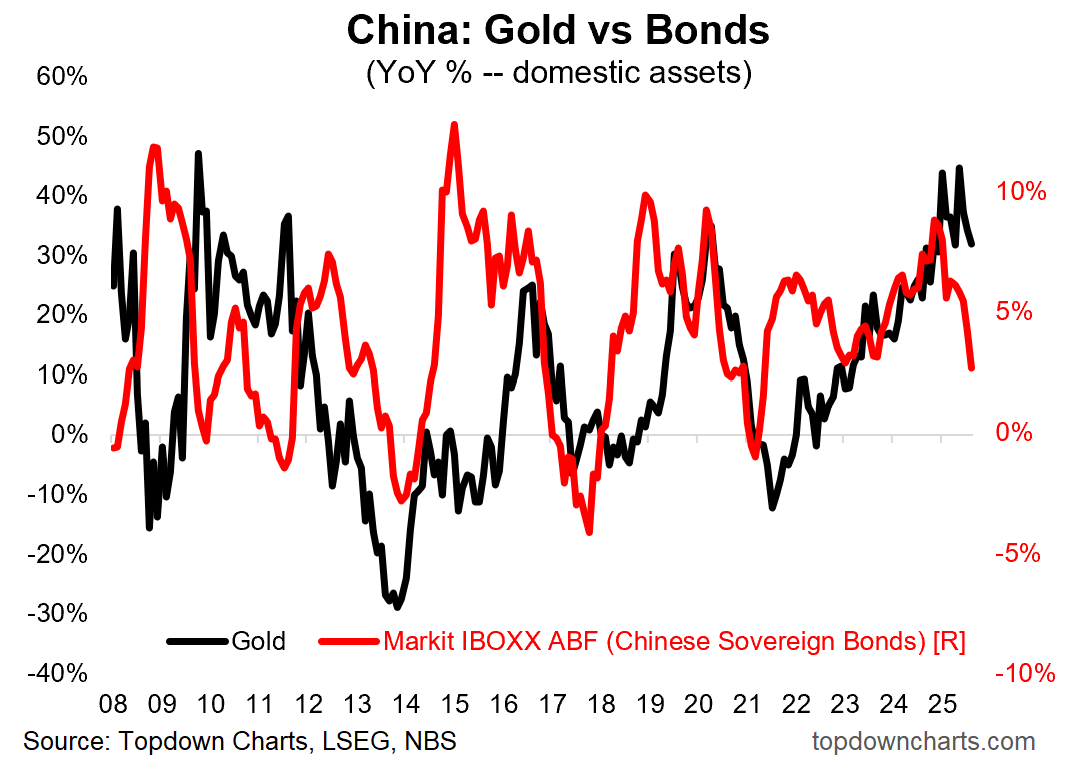
I highlighted in my latest Weekly Macro Themes report that Chinese government bond yields are on the move higher… as the chart below shows, this could be an issue for gold: “One risk of downside in CGBs would be rotation out of bonds *and gold* (removing a previous tailwind for gold)”. (source)
This note was brought to you by the Monthly Gold Market Chartbook
About the Monthly Gold Market Chartbook
The monthly Gold Market Chartbook is specifically designed to help busy investors quickly + easily understand the key drivers of risk vs opportunity in the gold market (and how it fits into traditional portfolios).
The pack includes over 70 charts, specialized indicators, and unique data, spanning:
Sentiment/Flows/Positioning (where are the pressures building up?)
Technicals, Global Gold Price (momentum, trend, divergences)
Long-term & Valuation Indicators (is gold overvalued?)
Gold Influences: Monetary & Macro (monetary tailwinds in play)
Gold Influences: Supply & Demand (supply vs demand outlook)
Gold Priced in other Currencies (what’s gold doing elsewhere?)
Gold Price Ratios (how is gold performing vs other assets?)
Asset Allocation Perspectives on Gold (how does gold fit in portfolios?)
Asset Watch: Stocks/Bonds/USD/Credit (risks vs opportunities in other major asset classes — and how that compares vs gold)
Silver Charts Section: sentiment, positioning, flows, valuations (i.e. how is the outlook for silver prices?)
NEW: Gold Miners: valuations, flows, allocations, fundamentals (i.e. what’s the risk/return setup for Gold Mining stocks?)
NEW: Other Precious Metals (Platinum & Palladium charts)
Act Now — (if you’re not already a subscriber), sign up to get instant access to the latest chartbook + archives; level-up your understanding and visibility on the key risks & opportunities in gold and precious metals investing.
If you have any questions/suggestions about the material or requests, simply get in touch via the website, we’d love to hear your thoughts.
Best wishes,
Callum Thomas
Head of Research & Founder
Topdown Charts | www.topdowncharts.com
LinkedIn: https://www.linkedin.com/in/callum-thomas-4990063/
NEW: Other services by Topdown Charts
Topdown Charts Entry-Level — [TD entry-level service]
Topdown Charts Professional — [institutional service]
Weekly S&P 500 ChartStorm —[US Equities in focus]
Monthly Gold Market Pack — [Gold charts]
Australian Market Valuation Book —[Aussie markets]


Gold and silver miners will hog all the action like today while gold and silver are silent spectators. Exceptional UVCMI scores in 90s for more than 30 eeeks, miner momentum is nowhere near dissipation. Also everyday I see Range Breskouts in my PM 100 list.