GoldNuggets — Gold vs Base Metals
GoldNuggets Digest: gold price technicals, downside risks, copper bullish setup, copper vs gold ratio, industrial metals outlook...
The GoldNuggets Digest is our free publication. It contains "nuggets" of Charts & Research that come across our desk on gold and investing which we think will be interesting and useful for investors.
Please feel welcome to share this with friends and colleagues! :-)
Global Gold Price Index
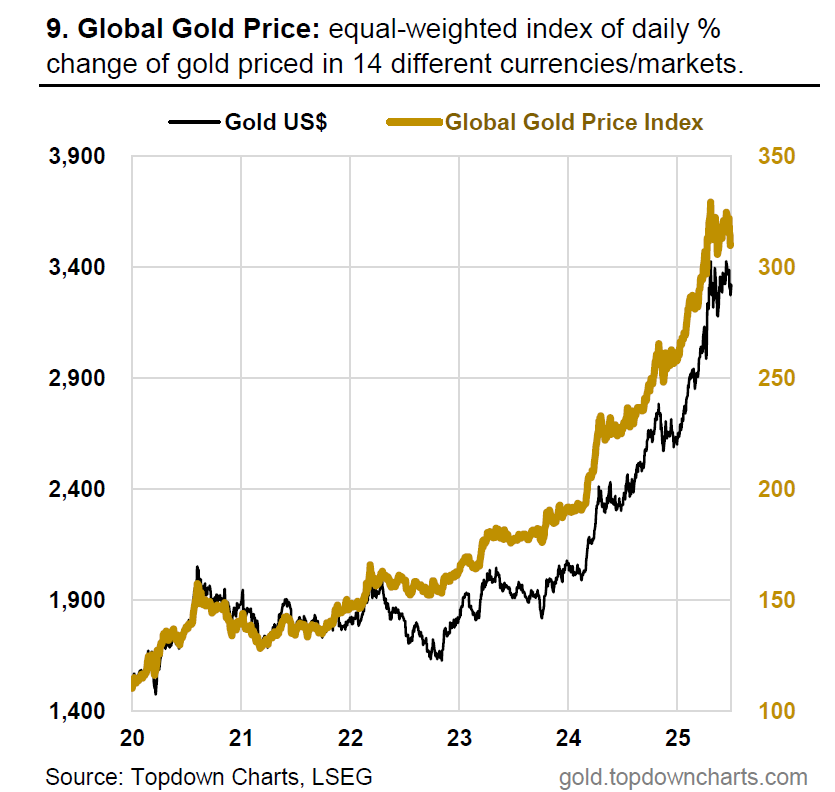
Here’s a preview from the June Monthly Gold Market Chartbook (I will be sending the pack out later today) — we can see 2 clear issues here.
First, our Global Gold Price Index (equal-weighted index tracking gold traded in 14 different currencies) has clearly peaked for now, and put in a lower high. Second, that US$3400 level is really proving to be a major point of resistance.
Global Gold Price Breadth
Taking another angle on it, the composite breadth indicator in this chart tracks price movements for gold traded in 14 different currencies (and combines 50 day, 200 day moving average breadth and 52-week new highs vs new lows). (source)
The key issue here is that we are seeing a sequence of lower highs in the breadth indicator vs higher highs in the gold price (meaning progressively less stronger and less widespread bullish momentum in the gold market). Technical analysts call that a bearish divergence — something that warns of a potential turning point, and at the very least should make one mindful of risk management.
The upside is that breadth has not yet outright collapsed below the line into bearish territory (something that would flag a transition from bull market and uptrend to more bearish price action). So it’s a case of continued careful monitoring, particularly as the macro backdrop begins to change…
Copper
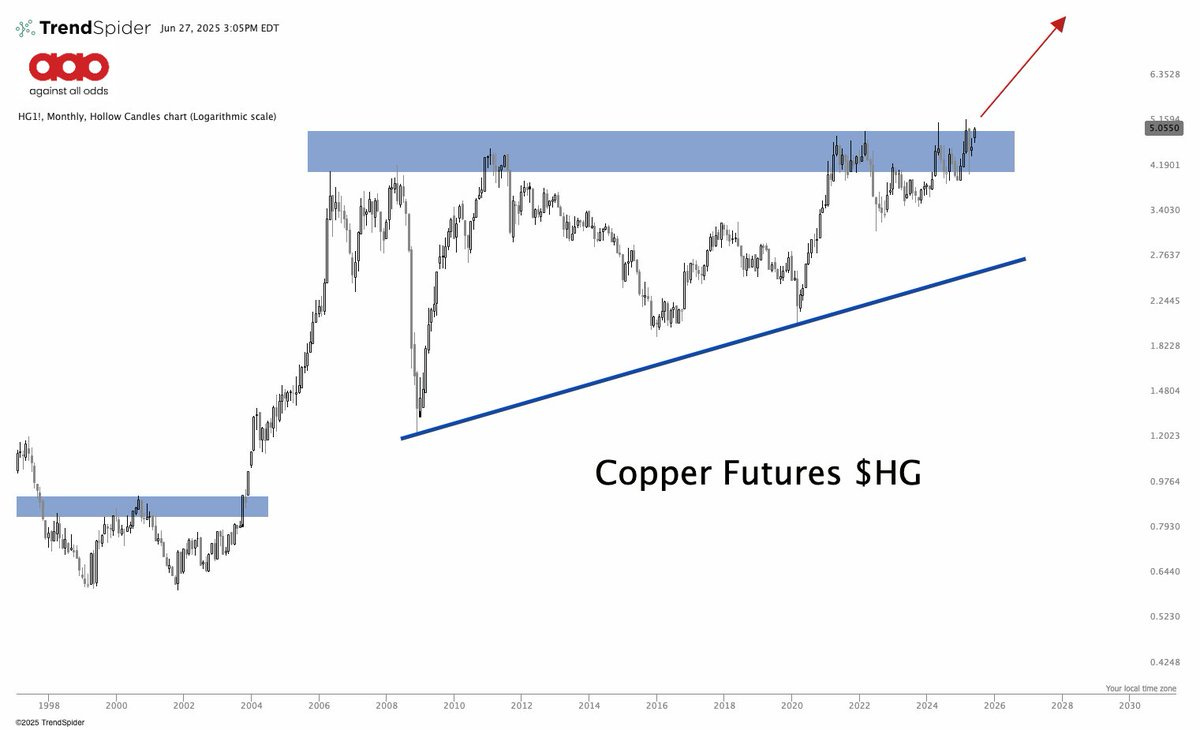
One sign of the changing macro backdrop is the increasingly bullish setup observed in copper prices.
As Jason Perz notes: “Copper is coiling. Not just any setup—this is a 20-year base. Now we’re back at the top of the range. If it breaks out? It’s not just copper going higher. It’s the world saying: We’re building again.“ (source)
Copper/Gold Ratio
Indeed, as it related to gold and precious metals, we may be on the cusp of a big rotation in relative performance as the more growth-sensitive base metals begin to play catch-up and ride the wave of an improving global growth outlook and seeming improvement in the geopolitical risk backdrop. (source)
Industrial Metals
Elsewhere I’ve been talking about the “macro risk sandwich“ — i.e. the two big macro tail risks of recession and deflation on the downside vs reacceleration and resurgence on the upside. The weight of all evidence I track (leading indicators, higher frequency economic activity data, central bank actions and monetary conditions) all point to increasing odds of a global economic upturn into H2, and that’s the kind of thing that will help industrial metal prices.
That’s why I’ve been telling clients to keep track of this chart because it will be the first to let us know as to which side of the macro risk sandwich we’re going to get a bite out of (up = reacceleration, down = recession). (source)
This note was brought to you by the Monthly Gold Market Chartbook
About the Monthly Gold Market Chartbook
The monthly Gold Market Chartbook is specifically designed to help busy investors quickly + easily understand the key drivers of risk vs opportunity in the gold market (and how it fits into traditional portfolios).
The pack includes over 60 charts, specialized indicators, and unique data, spanning:
Sentiment/Flows/Positioning (where are the pressures building up?)
Technicals, Global Gold Price (momentum, trend, divergences)
Long-term & Valuation Indicators (is gold overvalued?)
Gold Influences: Monetary & Macro (monetary tailwinds in play)
Gold Influences: Supply & Demand (supply vs demand outlook)
Gold Priced in other Currencies (what’s gold doing elsewhere?)
Gold Price Ratios (how is gold performing vs other assets?)
Asset Allocation Perspectives on Gold (how does gold fit in portfolios?)
Asset Watch: Stocks/Bonds/USD/Credit (risks vs opportunities in other major asset classes — and how that compares vs gold)
NEW: Silver Charts Section: sentiment, positioning, flows, valuations (i.e. how is the outlook for silver prices?)
Act Now — Activate a 7-day Trial Pass to get instant access to the latest chartbook + archives and see if it’s right for you and something you’d like to support:
If you have any questions/suggestions about the material or requests, simply get in touch via the website, we’d love to hear your thoughts.
Best wishes,
Callum Thomas
Head of Research & Founder
Topdown Charts | www.topdowncharts.com
LinkedIn: https://www.linkedin.com/in/callum-thomas-4990063/
NEW: Other services by Topdown Charts
Topdown Charts Entry-Level — [TD entry-level service]
Topdown Charts Professional — [institutional service]
Weekly S&P 500 ChartStorm —[US Equities in focus]
Monthly Gold Market Pack — [Gold charts]
Australian Market Valuation Book —[Aussie markets]


Thank you Callum. I've asked a couple of other precious metals writers to start a 'Commodity Comparative' site. But most are only focused on the values in terms of Dollars, and a chart comparing gold/silver with other solid assets is time consuming and distracts from the business of bullion sales.
Tracking comparisons, as I done for years, allows investors to better understand the economy and to see opportunities in other markets. This is more important for small scale and long term investors than it is for those who trade frequently.
Successful investors win with relative trades rather than simply in dollar denominated balances.
BTW. I'm not afraid of metal prices declining significantly, except in the "Drama Club: including Uranium/Lithium/ and rare earths? Most or the others roughly align with the longterm increase in the money supply.