
GoldNuggets — Big Picture Moves
GoldNuggets Digest: gold price breakout, valuation issues, central bank reserves reversal, stocks vs gold in the long-run, gold vs other assets...

The GoldNuggets Digest is our weekly publication. It contains "nuggets" of Charts & Research on gold, commodities, and macro —which we think will be interesting and useful for investors.
Consolidation Culmination
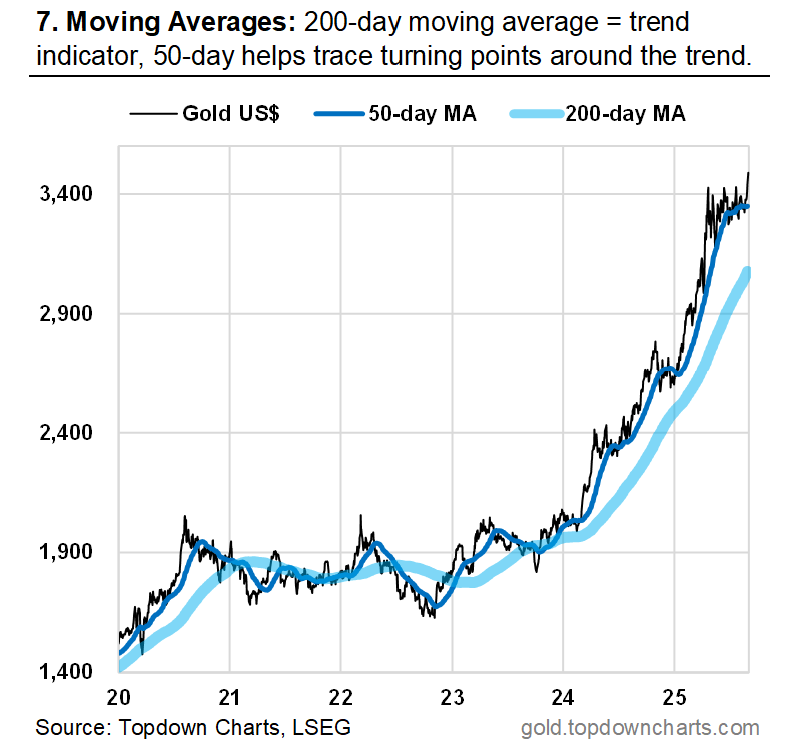
The big news in precious metals land of course has been the initial breakout in gold — it seems gold is finally shaking off that 5-month consolidation phase. (source)
I will caution though that this breakout has happened while US banks and exchanges are on holiday (Labor Day), so the next few days are going to be absolutely critical to see if the breakout can hold (vs fold).
If this breakout holds it’s going to be simply a case of onwards and upwards.
Issues in Valuations
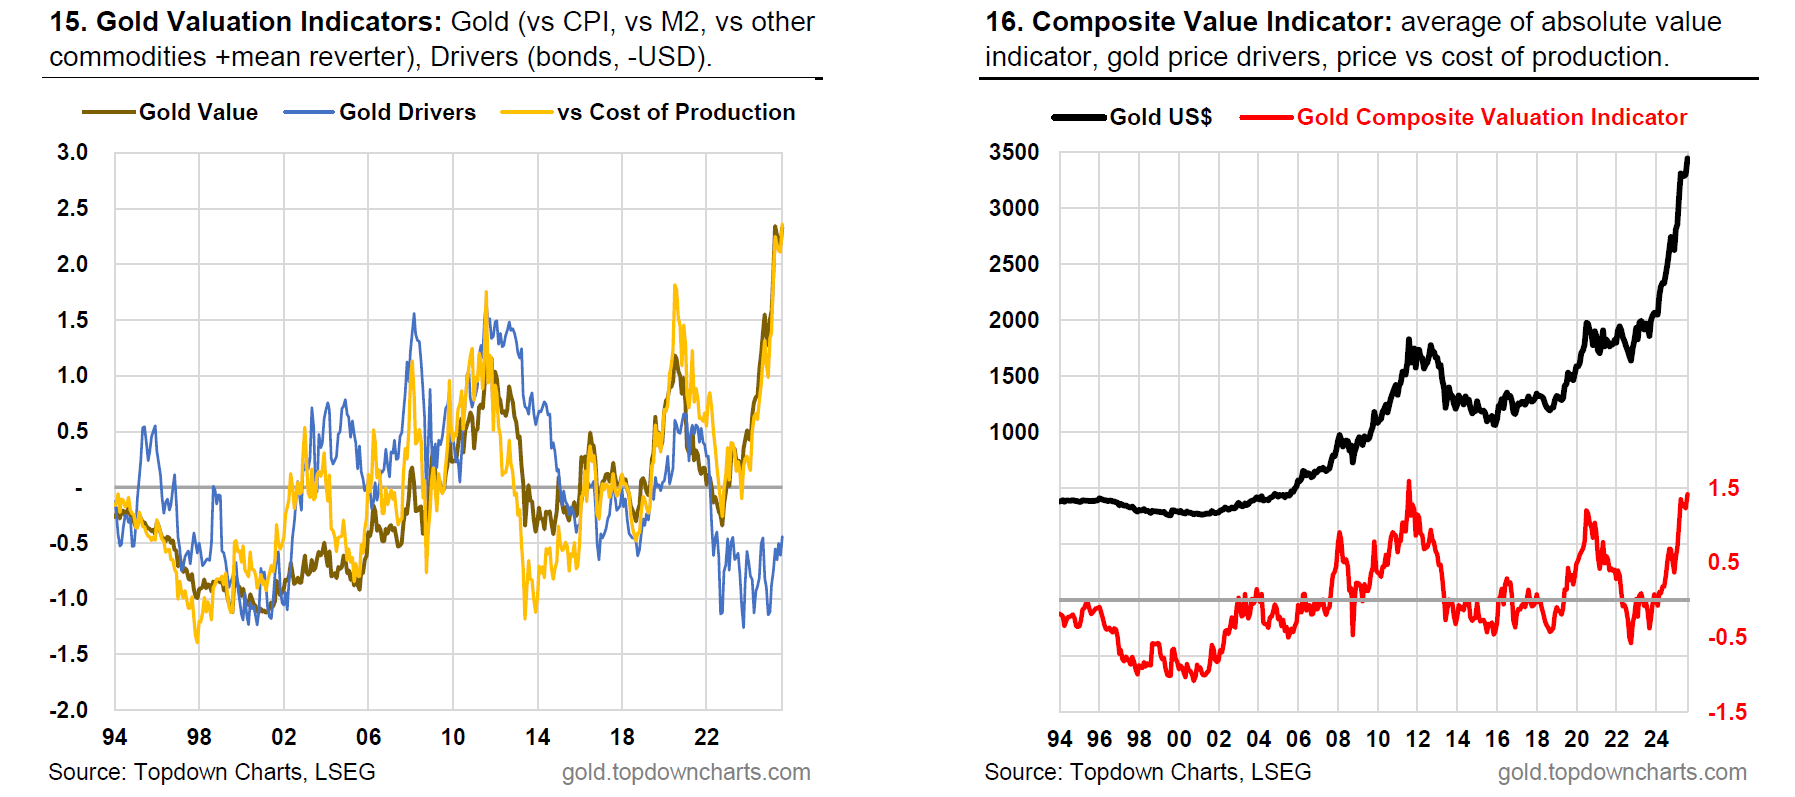
On the other hand, one of the key charts in the pack is that of valuations (and p.s. I asked the adobe AI to tell me the most interesting charts in the latest monthly pack pdf, and it came up with some very interesting and surprisingly good answers! —so a tip for subscribers: try asking AI about the monthly gold market chartbook pdf :-) (source)
The key issue is the composite valuation indicator is showing up as significantly expensive. But the key offsetting factors are three: 1. technicals still look strong; 2. monetary tailwinds (fiscal largesse, debasement, reserves diversification) are still significant; and 3. the gold-drivers value indicator (blue line below) is still cheap (i.e. the USD is expensive and can go lower [bullish gold], and bonds are cheap and therefore real yields could go lower [bullish gold]).
So it is something to be mindful of, but as they say: expensive markets can get more expensive…
[see also: Gold Valuation Indicators — Theory & Practice]
Reserves Reverse
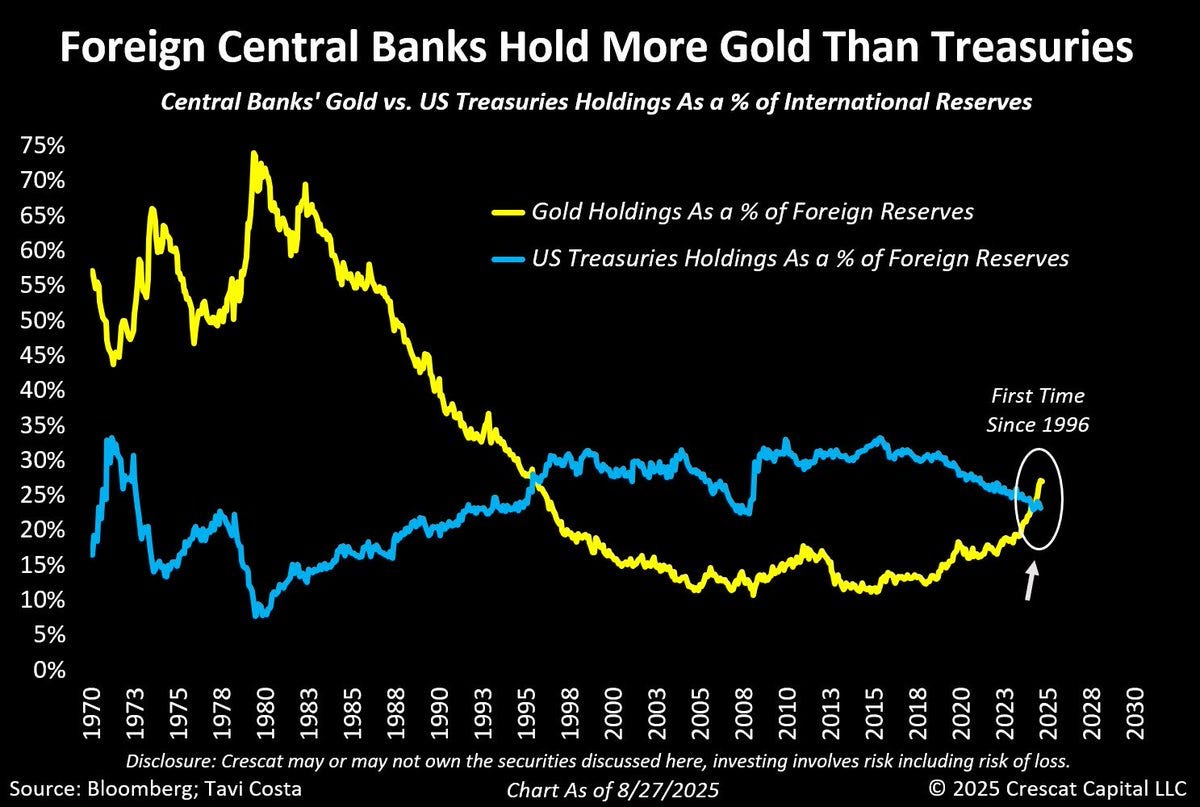
As noted, a key force behind the global gold bull market has been central banks reserves diversification.
As Tavi notes: “Foreign central banks now officially hold more gold than US Treasuries — for the first time since 1996. Let that sink in. If you think this buying streak is ending, just look at what happened in the 1970s. This is likely the beginning of one of the most significant global rebalancings we've experienced in recent history, in my view.” (source)
Stocks vs Gold
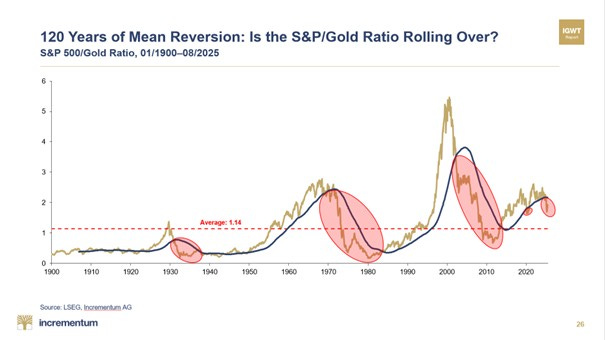
And that could mean big things for gold relative to stocks… as Ronnie notes: “120 years of history say it loud: Did the S&P 500 / Gold ratio just roll over? To mean revert back to its long-term average (1.14), gold would need to triple.
Every past collapse (1930s, 1970s, 2000s) = gold’s biggest bull runs.” (source)
Although I would note for completeness: technically you could also get mean reversion by stocks slumping and gold either holding ground or falling less than stocks (and stocks do look a bit frothy).
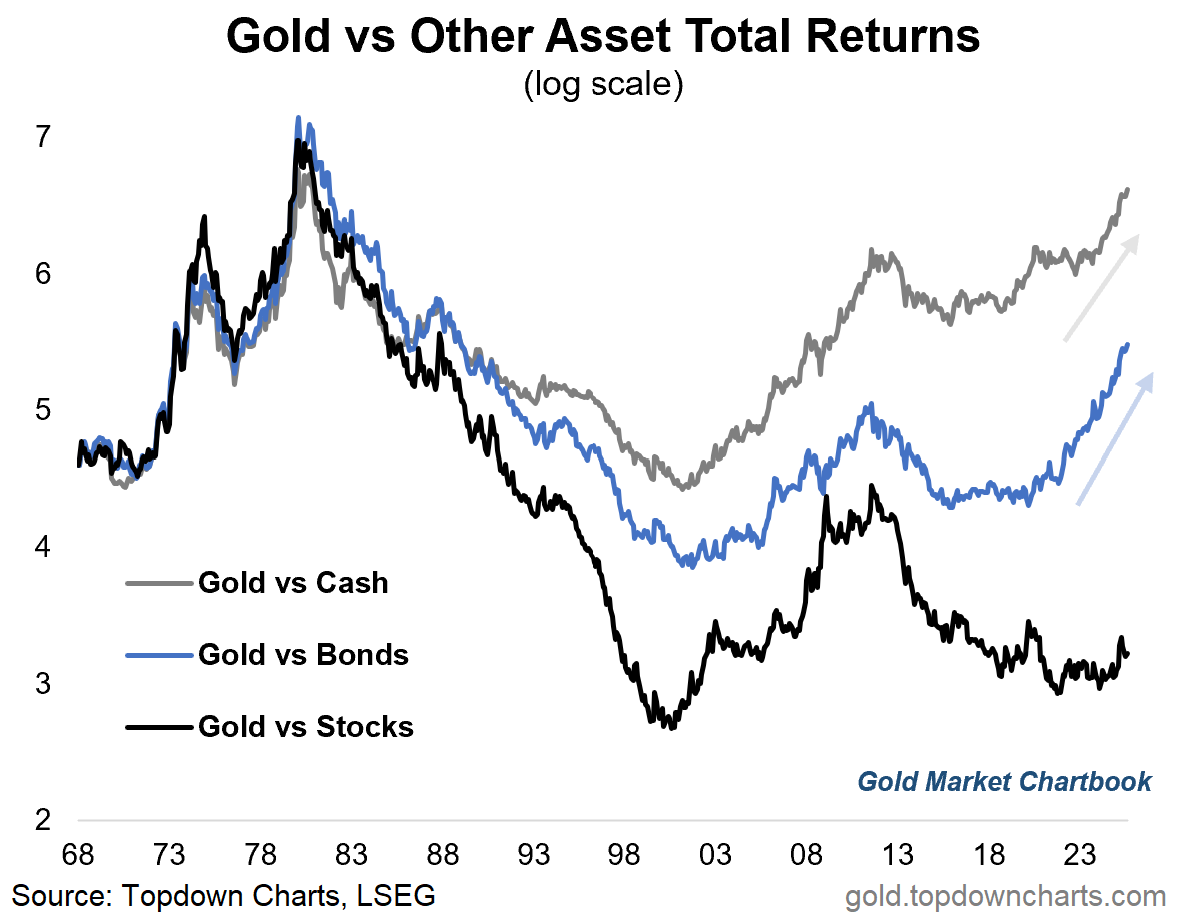
Gold vs Major Assets
Finally, here’s another angle on gold vs stocks (this is showing it the other way round i.e. the ratio of gold to stocks; *and* in total return terms; i.e. including dividends for stocks, and interest for cash/bonds). (source)
See if you can spot the odd one out…
This note was brought to you by the Monthly Gold Market Chartbook
About the Monthly Gold Market Chartbook
The monthly Gold Market Chartbook is specifically designed to help busy investors quickly + easily understand the key drivers of risk vs opportunity in the gold market (and how it fits into traditional portfolios).
The pack includes over 70 charts, specialized indicators, and unique data, spanning:
Sentiment/Flows/Positioning (where are the pressures building up?)
Technicals, Global Gold Price (momentum, trend, divergences)
Long-term & Valuation Indicators (is gold overvalued?)
Gold Influences: Monetary & Macro (monetary tailwinds in play)
Gold Influences: Supply & Demand (supply vs demand outlook)
Gold Priced in other Currencies (what’s gold doing elsewhere?)
Gold Price Ratios (how is gold performing vs other assets?)
Asset Allocation Perspectives on Gold (how does gold fit in portfolios?)
Asset Watch: Stocks/Bonds/USD/Credit (risks vs opportunities in other major asset classes — and how that compares vs gold)
Silver Charts Section: sentiment, positioning, flows, valuations (i.e. how is the outlook for silver prices?)
NEW: Gold Miners: valuations, flows, allocations, fundamentals (i.e. what’s the risk/return setup for Gold Mining stocks?)
NEW: Other Precious Metals (Platinum & Palladium charts)
Act Now — (if you’re not already a subscriber), sign up to get instant access to the latest chartbook + archives; level-up your understanding and visibility on the key risks & opportunities in gold and precious metals investing.
If you have any questions/suggestions about the material or requests, simply get in touch via the website, we’d love to hear your thoughts.
Best wishes,
Callum Thomas
Head of Research & Founder
Topdown Charts | www.topdowncharts.com
LinkedIn: https://www.linkedin.com/in/callum-thomas-4990063/
NEW: Other services by Topdown Charts
Topdown Charts Entry-Level — [TD entry-level service]
Topdown Charts Professional — [institutional service]
Weekly S&P 500 ChartStorm —[US Equities in focus]
Monthly Gold Market Pack — [Gold charts]
Australian Market Valuation Book —[Aussie markets]