
GoldNuggets — Gold Season +Rotation
GoldNuggets Digest: gold price seasonality, gold vs stocks ratio, investor gold allocations, silver price sentiment, commodities vs gold...

The GoldNuggets Digest is our free publication. It contains "nuggets" of Charts & Research that come across our desk on gold and investing which we think will be interesting and useful for investors.
Please feel welcome to share this with friends and colleagues! :-)
Gold Season
The next 3 months historically have been some of the best months of the year for the gold price (both in terms of probability of gains and average price change. (source)

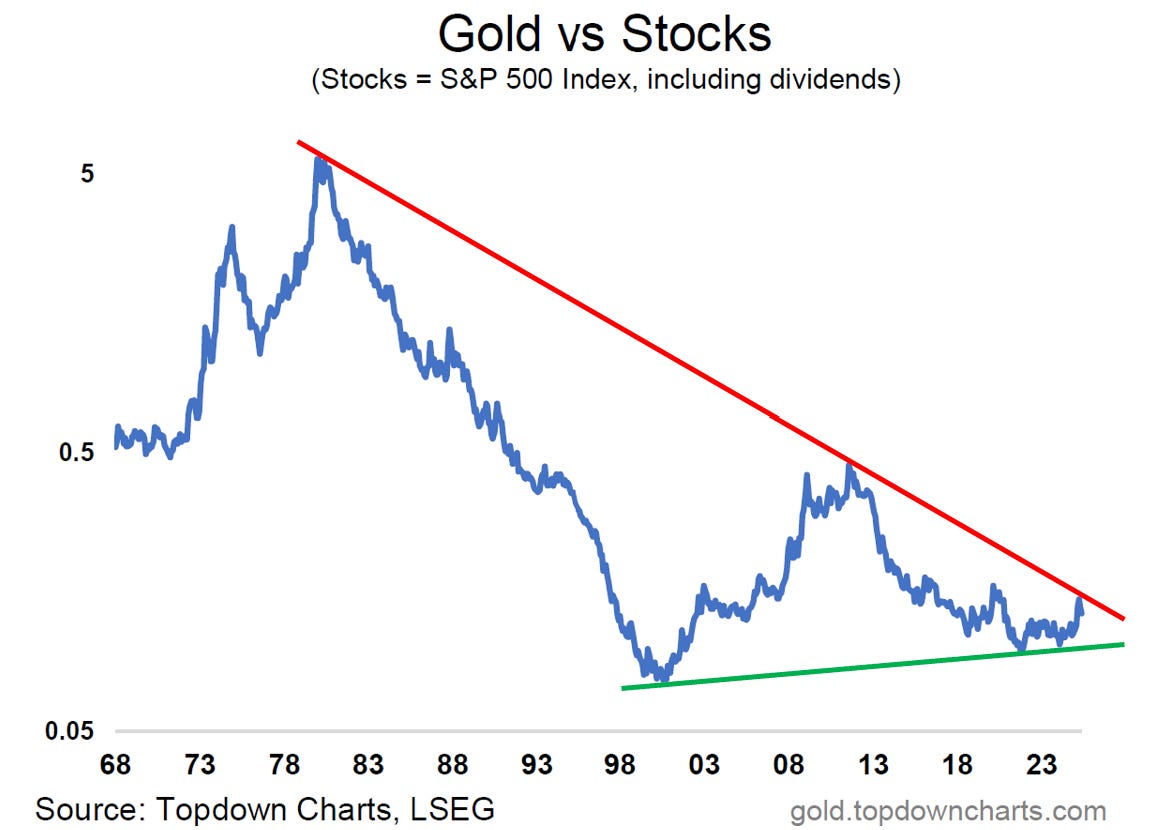
Gold vs Stocks
Interestingly, the gold vs stocks ratio made a short-term peak just as it hit that long-term downtrend line, the question from here is whether it goes all the way down to the support (green uptrend) line or makes a break. (source)
Gold Allocations
Meanwhile, investor allocations to gold remain historically light. Note, this does ignore other ways and means of holding gold (but also equally ignores other assets and portfolio holdings — being that this chart only looks at the ETF market). Still, again it’s interesting to reflect how light allocations are now vs the last big bull.

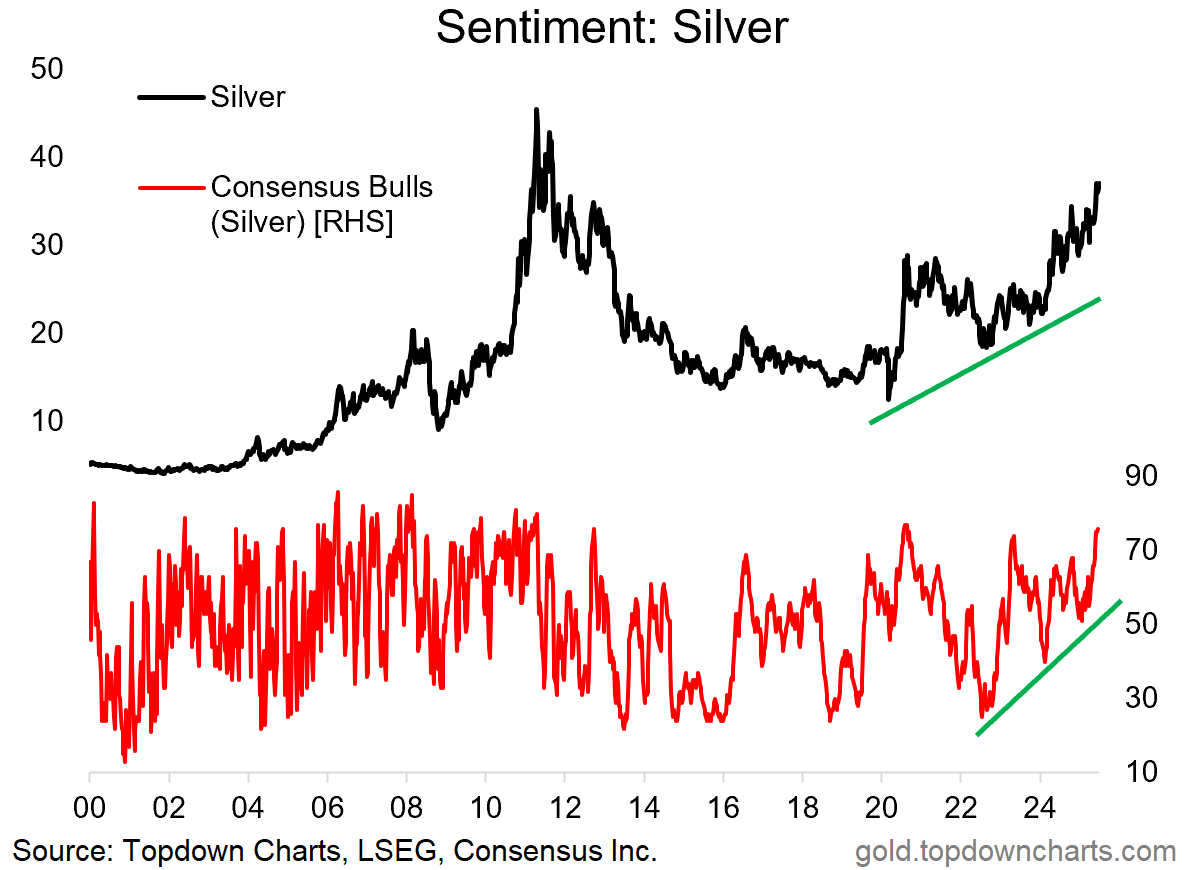
Silver Sentiment
Silver sentiment continues to trend up, and just today we got another tantalizing touch of the highs. The big question on everyone’s mind is when/whether this uptrend ultimately takes us on to new all-time highs.
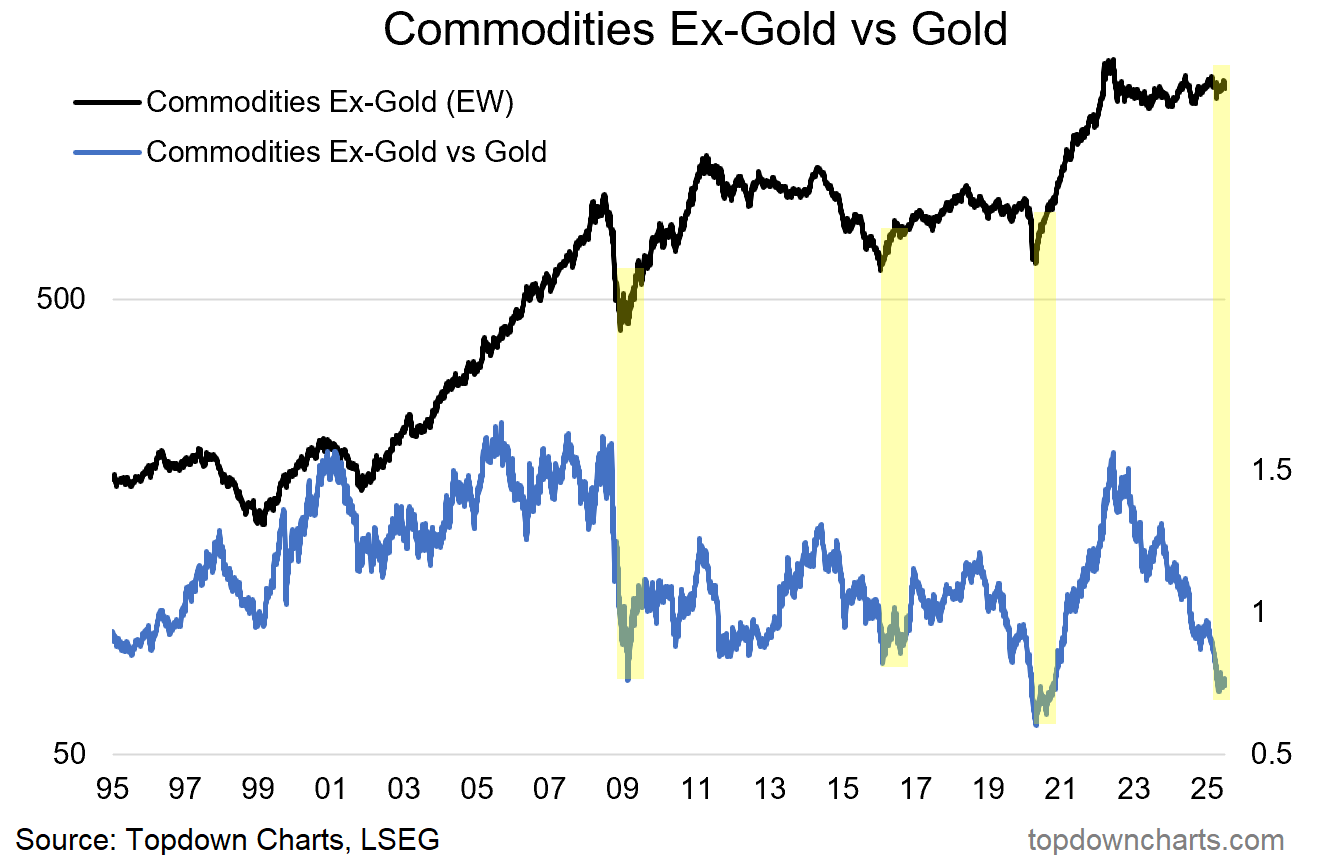
Commodities vs Gold
The ratio of my equal-weighted spot commodities price index vs the gold price is offering some bullish clues on the outlook for commodity prices. In the past when commodities significantly underperformed vs gold and then turned up, it portended a new cyclical bull in commodity prices.
This would certainly line up with my recent coverage of rotation prospects in the commodity space (e.g. oil vs gold, copper vs gold).
This note was brought to you by the Monthly Gold Market Chartbook
About the Monthly Gold Market Chartbook
The monthly Gold Market Chartbook is specifically designed to help busy investors quickly + easily understand the key drivers of risk vs opportunity in the gold market (and how it fits into traditional portfolios).
The pack includes over 60 charts, specialized indicators, and unique data, spanning:
Sentiment/Flows/Positioning (where are the pressures building up?)
Technicals, Global Gold Price (momentum, trend, divergences)
Long-term & Valuation Indicators (is gold overvalued?)
Gold Influences: Monetary & Macro (monetary tailwinds in play)
Gold Influences: Supply & Demand (supply vs demand outlook)
Gold Priced in other Currencies (what’s gold doing elsewhere?)
Gold Price Ratios (how is gold performing vs other assets?)
Asset Allocation Perspectives on Gold (how does gold fit in portfolios?)
Asset Watch: Stocks/Bonds/USD/Credit (risks vs opportunities in other major asset classes — and how that compares vs gold)
NEW: Silver Charts Section: sentiment, positioning, flows, valuations (i.e. how is the outlook for silver prices?)
Act Now — Activate a 7-day Trial Pass to get instant access to the latest chartbook + archives and see if it’s right for you and something you’d like to support:
If you have any questions/suggestions about the material or requests, simply get in touch via the website, we’d love to hear your thoughts.
Best wishes,
Callum Thomas
Head of Research & Founder
Topdown Charts | www.topdowncharts.com
LinkedIn: https://www.linkedin.com/in/callum-thomas-4990063/
NEW: Other services by Topdown Charts
Topdown Charts Entry-Level — [TD entry-level service]
Topdown Charts Professional — [institutional service]
Weekly S&P 500 ChartStorm —[US Equities in focus]
Monthly Gold Market Pack — [Gold charts]
Australian Market Valuation Book —[Aussie markets]