
GoldNuggets — Paradigm Shifts
GoldNuggets Digest: tracking the debasement trade, devaluation of labor, gold breakouts vs other asset classes, gold vs bitcoin, the gold-oil anomaly...

The GoldNuggets Digest is our weekly publication. It contains “nuggets” of Charts & Research on gold, commodities, and macro —issues and insights which we think will be interesting and useful for investors.
Debasement
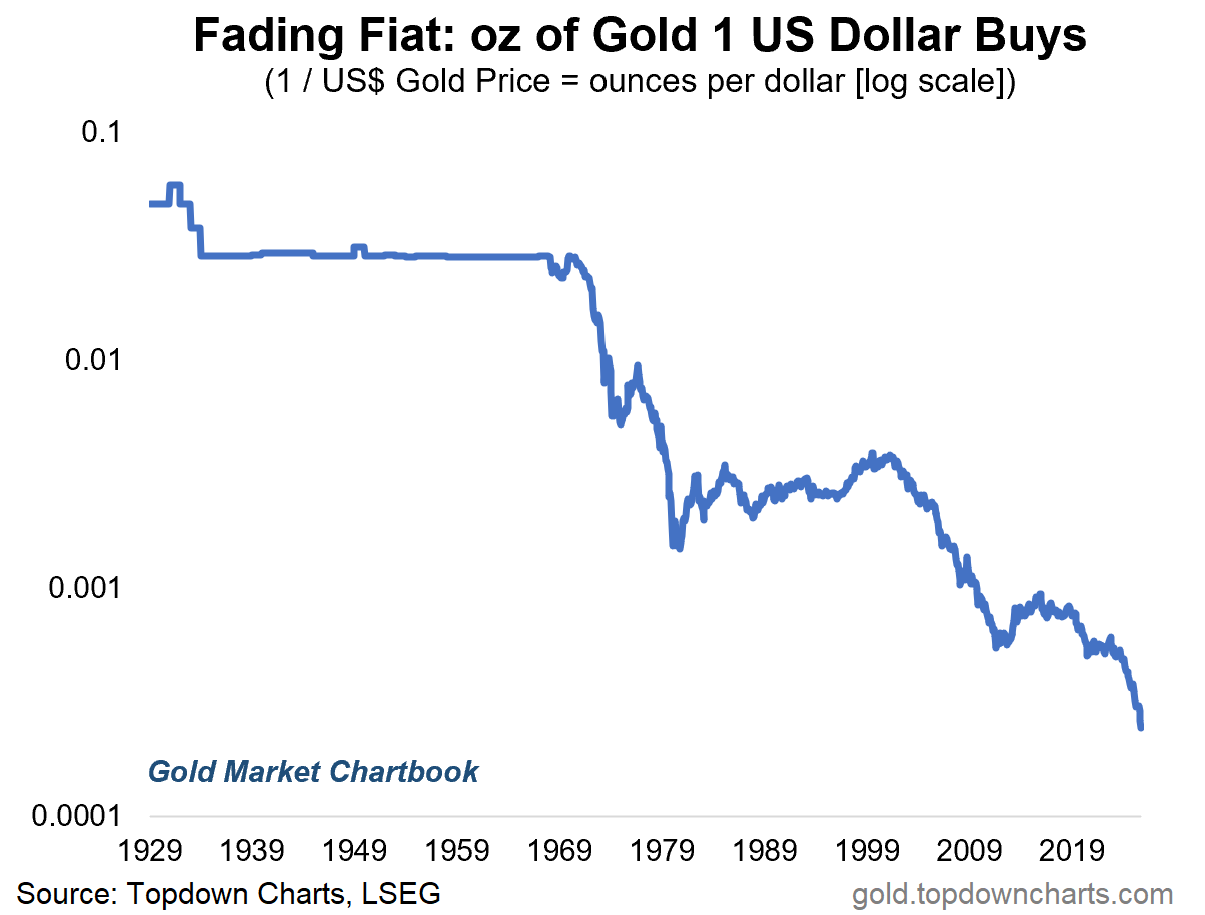
The flipside of surging gold prices is a long-term and near-consistent loss of purchasing power by the US dollar over time.
As they say: “invert, always invert“ (the chart shows how many ounces of gold you can buy with 1 US dollar — and n.b. it is in log scale).
Labor Devaluation
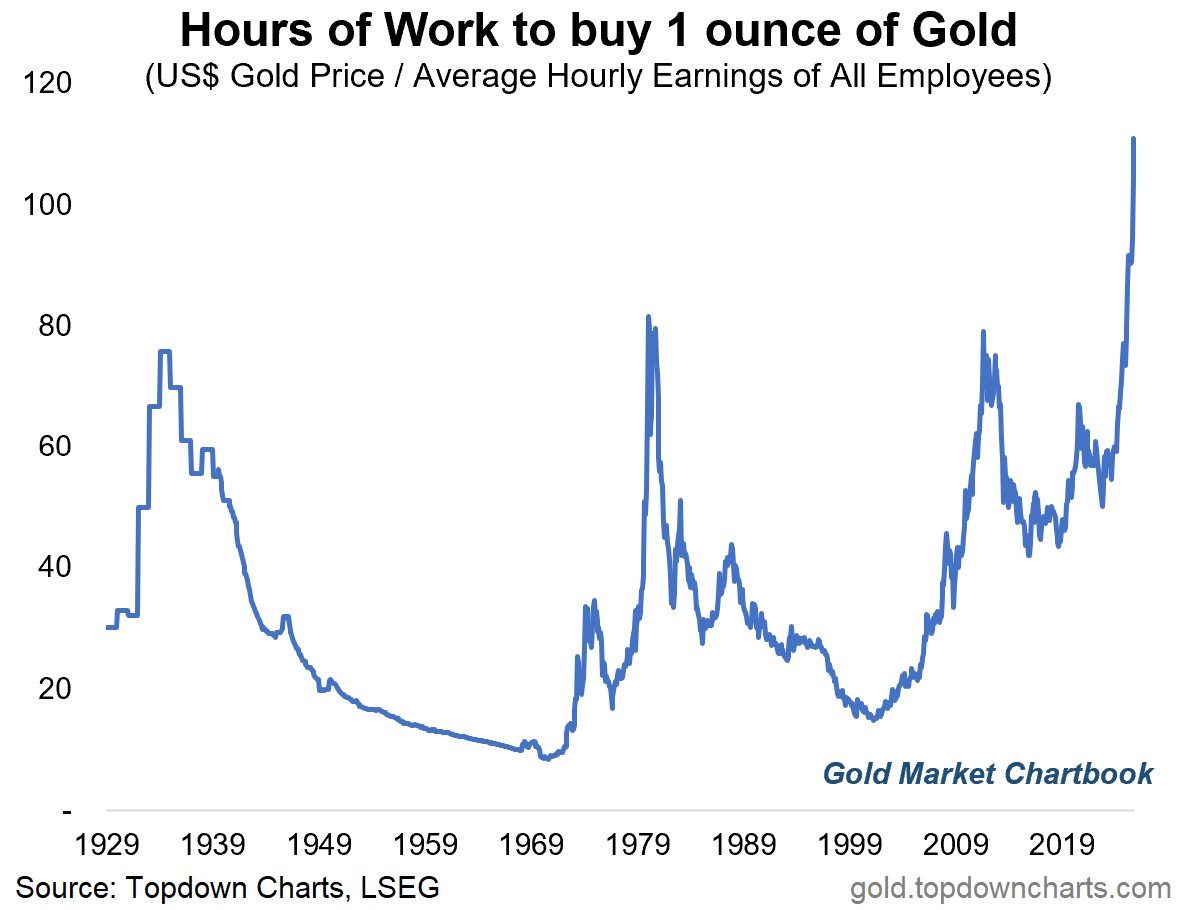
The other debasement going on is what you might effectively call the devaluation of labor. The hours of work it takes the average worker in the USA to buy 1 oz of gold has smashed out of the range that prevailed over the past 100 years to a new all-time high.
Gold vs Other Assets
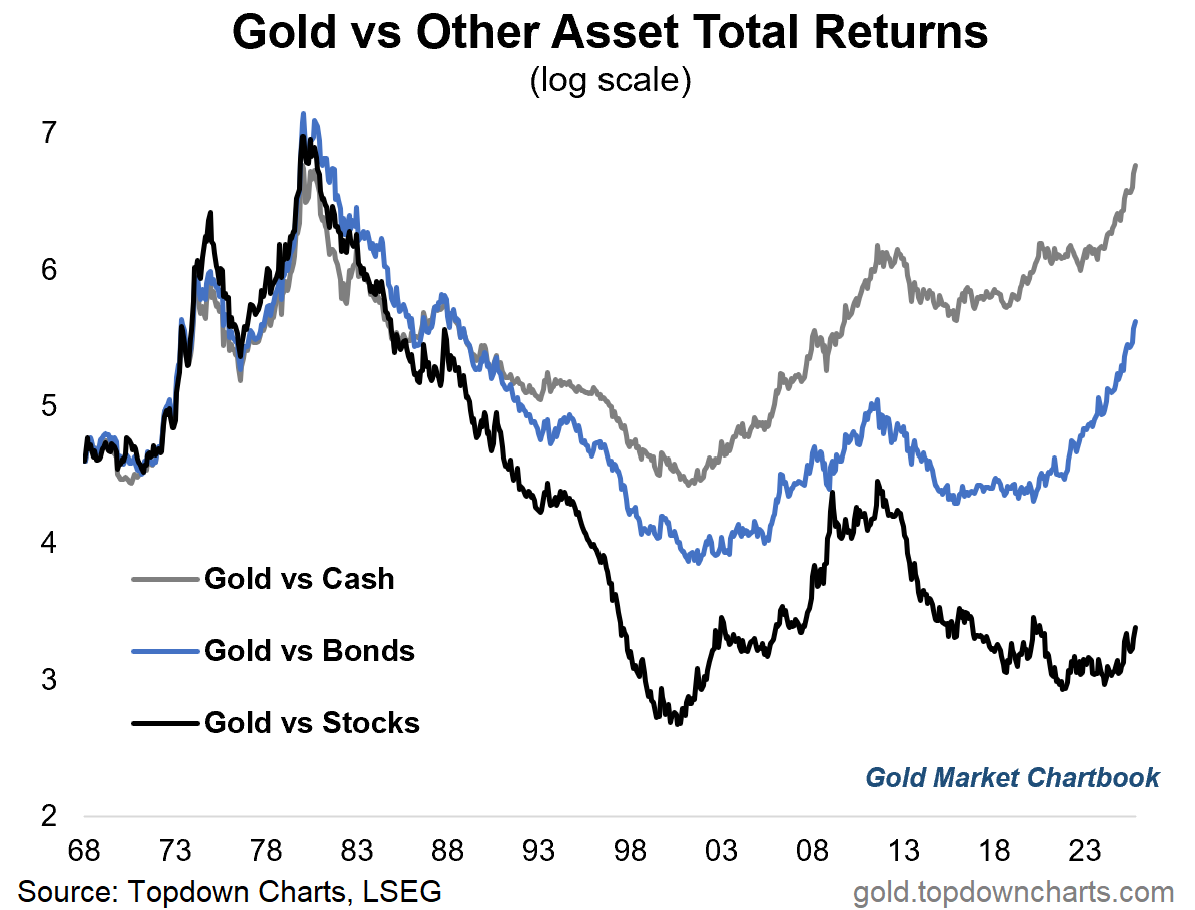
Gold has easily beaten the low bar set by cash and bonds (even including interest reinvested) — and now, with a lag, gold seems to be taking the upper hand vs the stockmarket (which has set a much higher performance hurdle).
This is a very interesting development in terms of the gold bull market, but also in terms of what it might mean for the stockmarket (pay attention to the periods when gold started beating stocks e.g. early-2000’s dot-com burst, and then again another wave up during the 08 financial crisis).
Gold vs Bitcoin
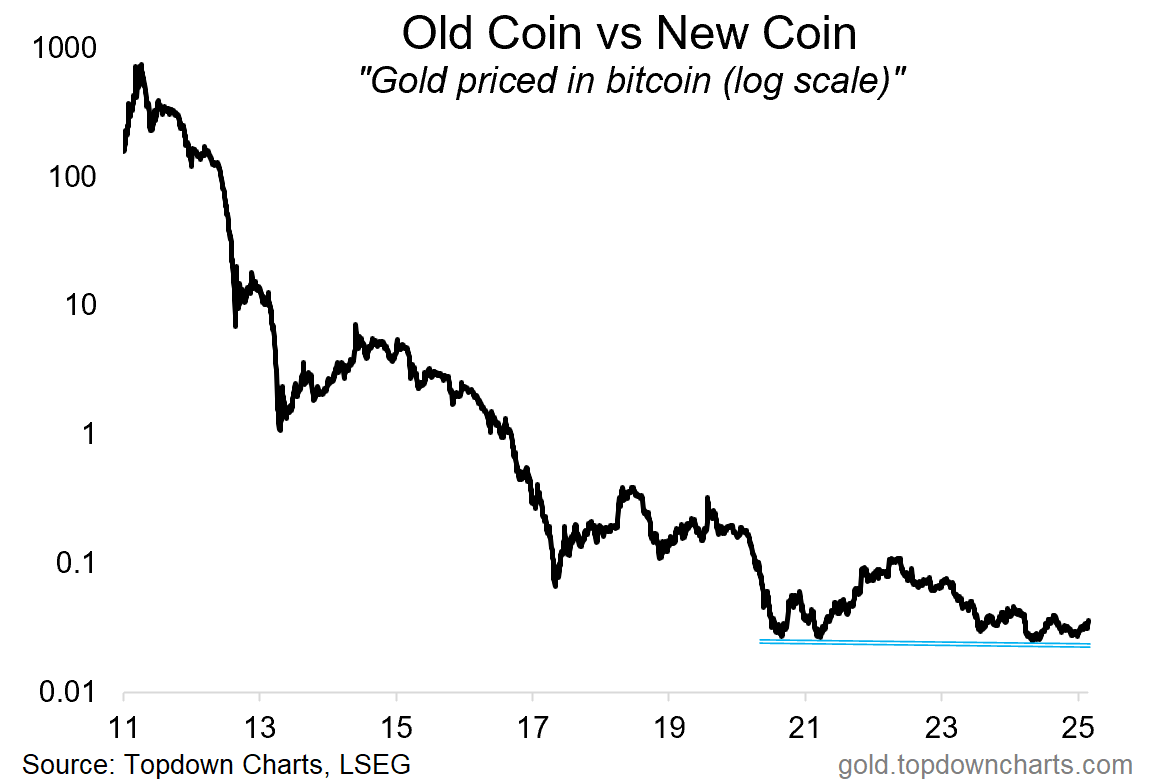
Here’s an interesting fact you might have missed: the gold vs bitcoin ratio has made a higher low (and is turning up again …also, the previous low occurred at a major support level).
Again, I think you can argue that this says as much about the momentum in gold as it does about the outlook for bitcoin (which in many ways behaves more like a risk asset and has a much higher correlation with stocks than bonds).
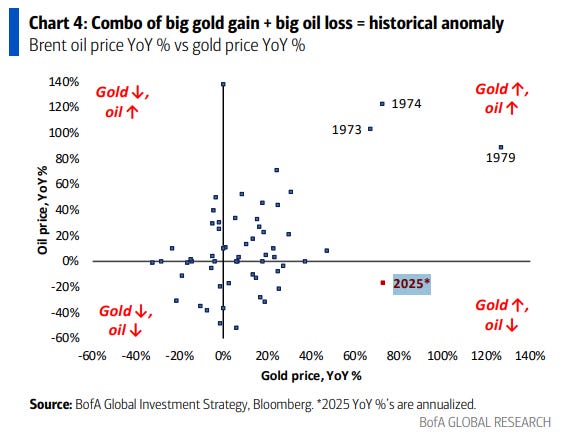
The Great Gold-Oil Anomaly of 2025
Lastly, keeping things big picture and perspective building this week, you might have seen it already, but I think it’s quite interesting and echoes some of what I’ve been saying recently (about oil vs gold).
“big gold gain + big oil loss = historical anomaly” (source)
This note was brought to you by the Monthly Gold Market Chartbook
About the Monthly Gold Market Chartbook
The monthly Gold Market Chartbook is specifically designed to help busy investors quickly + easily understand the key drivers of risk vs opportunity in the gold market (and how it fits into traditional portfolios).
The pack includes over 70 charts, specialized indicators, and unique data, spanning:
Sentiment/Flows/Positioning (where are the pressures building up?)
Technicals, Global Gold Price (momentum, trend, divergences)
Long-term & Valuation Indicators (is gold overvalued?)
Gold Influences: Monetary & Macro (monetary tailwinds in play)
Gold Influences: Supply & Demand (supply vs demand outlook)
Gold Priced in other Currencies (what’s gold doing elsewhere?)
Gold Price Ratios (how is gold performing vs other assets?)
Asset Allocation Perspectives on Gold (how does gold fit in portfolios?)
Asset Watch: Stocks/Bonds/USD/Credit (risks vs opportunities in other major asset classes — and how that compares vs gold)
Silver Charts Section: sentiment, positioning, flows, valuations (i.e. how is the outlook for silver prices?)
NEW: Gold Miners: valuations, flows, allocations, fundamentals (i.e. what’s the risk/return setup for Gold Mining stocks?)
NEW: Other Precious Metals (Platinum & Palladium charts)
Act Now — (if you’re not already a subscriber), sign up to get instant access to the latest chartbook + archives; level-up your understanding and visibility on the key risks & opportunities in gold and precious metals investing.
If you have any questions/suggestions about the material or requests, simply get in touch via the website, we’d love to hear your thoughts.
Best wishes,
Callum Thomas
Head of Research & Founder
Topdown Charts | www.topdowncharts.com
LinkedIn: https://www.linkedin.com/in/callum-thomas-4990063/
NEW: Other services by Topdown Charts
Topdown Charts Entry-Level — [TD entry-level service]
Topdown Charts Professional — [institutional service]
Weekly S&P 500 ChartStorm —[US Equities in focus]
Monthly Gold Market Pack — [Gold charts]
Australian Market Valuation Book —[Aussie markets]