
GoldNuggets — Peaks & Asset Allocation
GoldNuggets Digest: ETF holdings of gold, gold price valuation indicator, gold vs bonds, family office asset allocations, gold price forecasts...

The GoldNuggets Digest is our free publication. It contains "nuggets" of Charts & Research that come across our desk on gold and investing which we think might be interesting and useful for investors.
Please feel welcome to share this with friends and colleagues :-)
+ p.s. be sure to mention/follow us on social media: X/Twitter & LinkedIn
Retail Arrived
Turns out the Gold price peaked just as retail started piling in. (source)

Extreme Expensive
While there are strong monetary tailwinds behind gold and an entrenched bull trend, the expensive valuation signal in the chart below —alongside overbought technicals, consensus bullishness, and extended flows/positioning— make for an uncertain outlook, and a period of consolidation and correction is probably a healthy thing for the gold price at this point. (source)

Gold vs Bonds
Gold has done an outstanding job as a bond alternative — and has not only outperformed as a diversifier in downturns, but has outright added to returns even as risk assets have performed well. (source)
And yet… (see next chart)

Family Offices vs Gold
Ronnie Stoeferle remarks on this chart of family office asset allocations: “You really need good eyes to spot gold in this pie chart…confirms my impression from attending some family office conferences: they could not care less about gold…“ (source)
The situation shown in this chart is quite absurd given that gold has significantly outperformed vs other defensive assets like fixed income. In my view it represents a misunderstanding of core asset allocation principles and lost opportunity to improve risk-adjusted return outcomes [n.b. the asset allocation section in the monthly pack addresses this issue by comparing the traditional 60/40 to a gold 60/40].

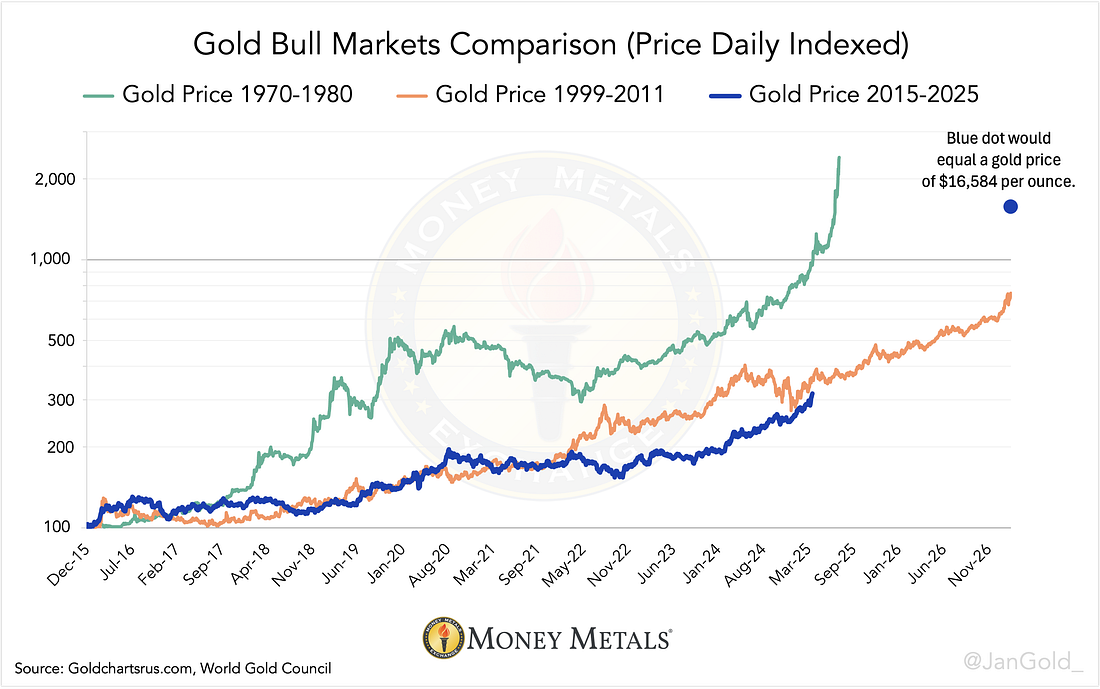
Gold $16,000 ?
Jan Nieuwenhuijs points out: “From 1970 until 1980, the price of gold rose 23-fold. From 1999 until 2011, gold went up 6.5X. On average, that’s a 16-fold increase. Measured from the most recent bottom in 2015, gold going up by 1700% would produce a price peak of over $16,000 per ounce.“ (source)
With the unpredictable and uncertain new political risk paradigm in the USA and market action so far this year, I would say anything is possible…
Log on to the website for more updates: gold.topdowncharts.com
ICYMI: Previous edition GoldNuggets — Gold Top, Bull Case
Not a Subscriber yet? Learn more about the Monthly Gold Market Chartbook + Subscribe for updates (and upgrade to access the full monthly pack).
The recent dip (and recovery today) has some interesting correlation to the Chinese holiday, doesn’t it?