GoldNuggets — The Gold Bull Market
GoldNuggets Digest: gold market volatility, big breakout analogs, central bank buying, gold share of investable assets, gold vs stocks and bonds...
The GoldNuggets Digest is our weekly publication. It contains “nuggets” of Charts & Research on gold, commodities, and macro —issues and insights which we think will be interesting and useful for investors.
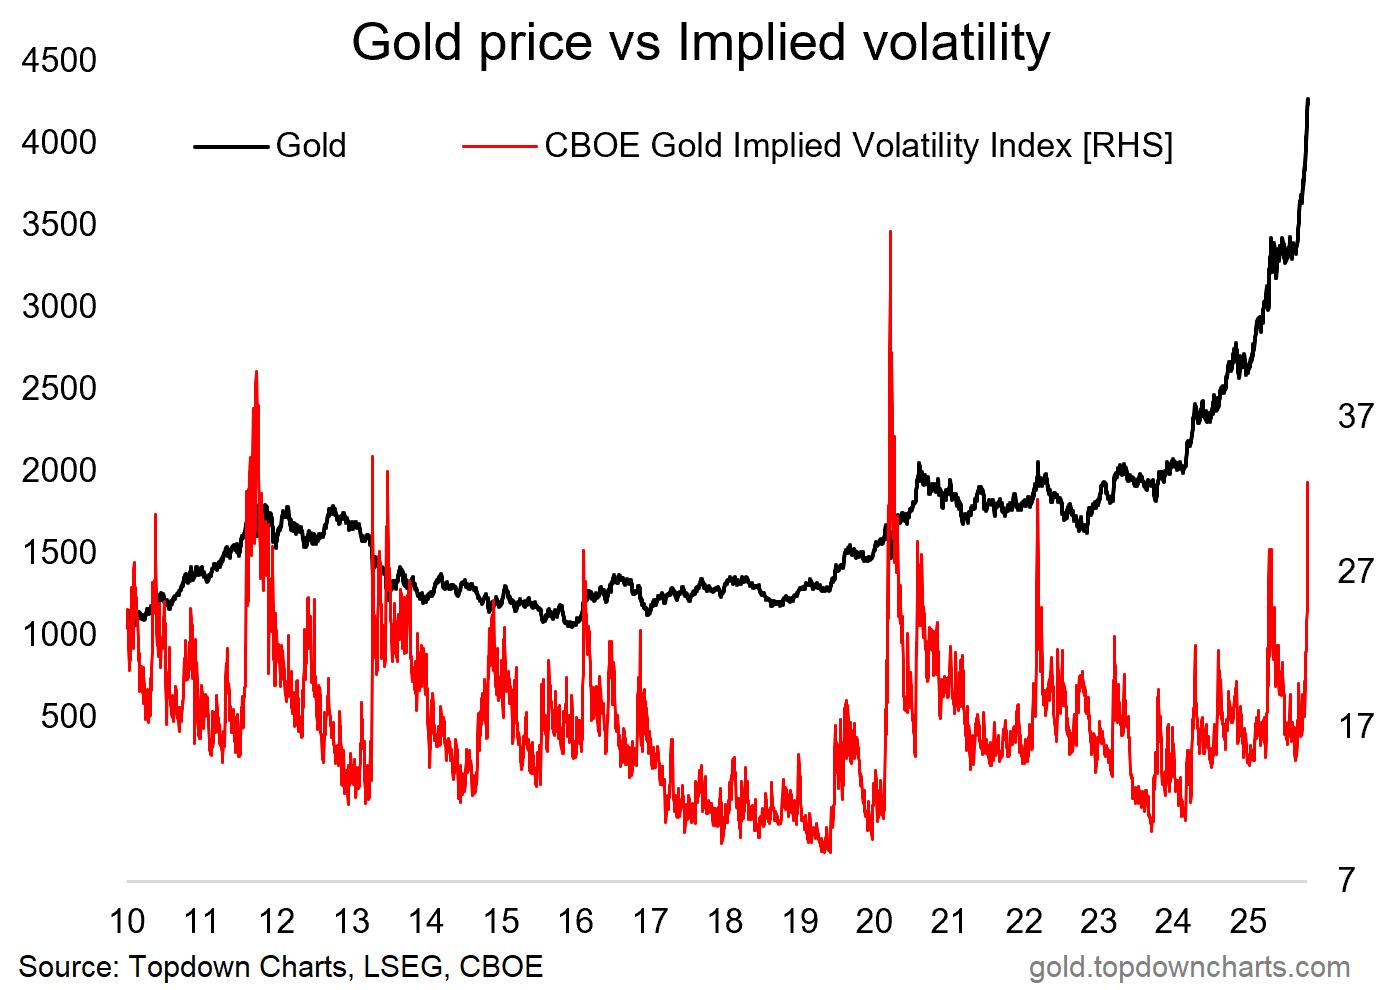
Gold Volatility
We just saw another spike in Gold market implied volatility. Spikes in GVZ (the CBOE gold implied volatility index) are often seen around turning points and trend exhaustions; and basically it suggests a period of consolidation — a pause in the gold bull.
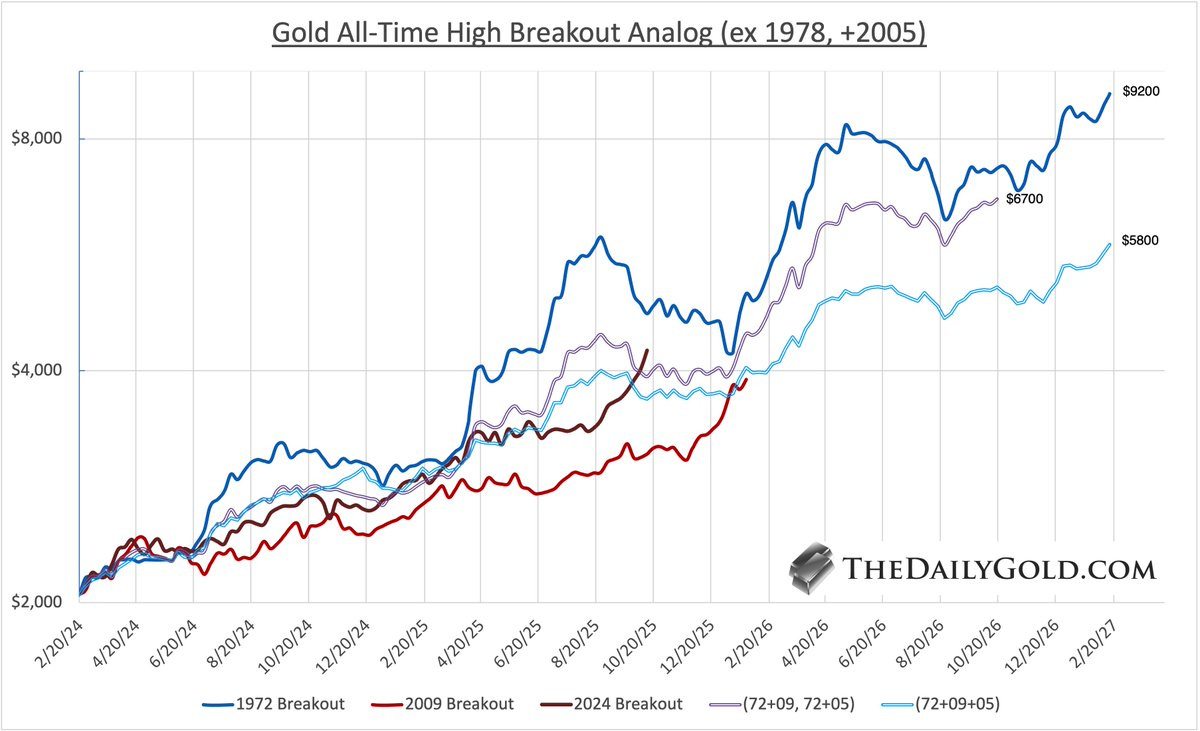
Gold Breakout Analogs
Interestingly this would be consistent with some of the previous major gold breakouts — as Jordan Roy-byrne points out below, past big breakouts have entered into a bit of consolidation and ranging around this stage before moving on to more gains. And the implication being that if it can get through a healthy consolidation then much greater upside could still be on the way.
“Gold All-Time High Breakout Analog Gold has followed the two averages closely. From around here, both averages corrected for 5 months, then surged higher. [this implies] Weaker = $5800 in 16 months, Stronger = $6700 in 10 months.” (source)
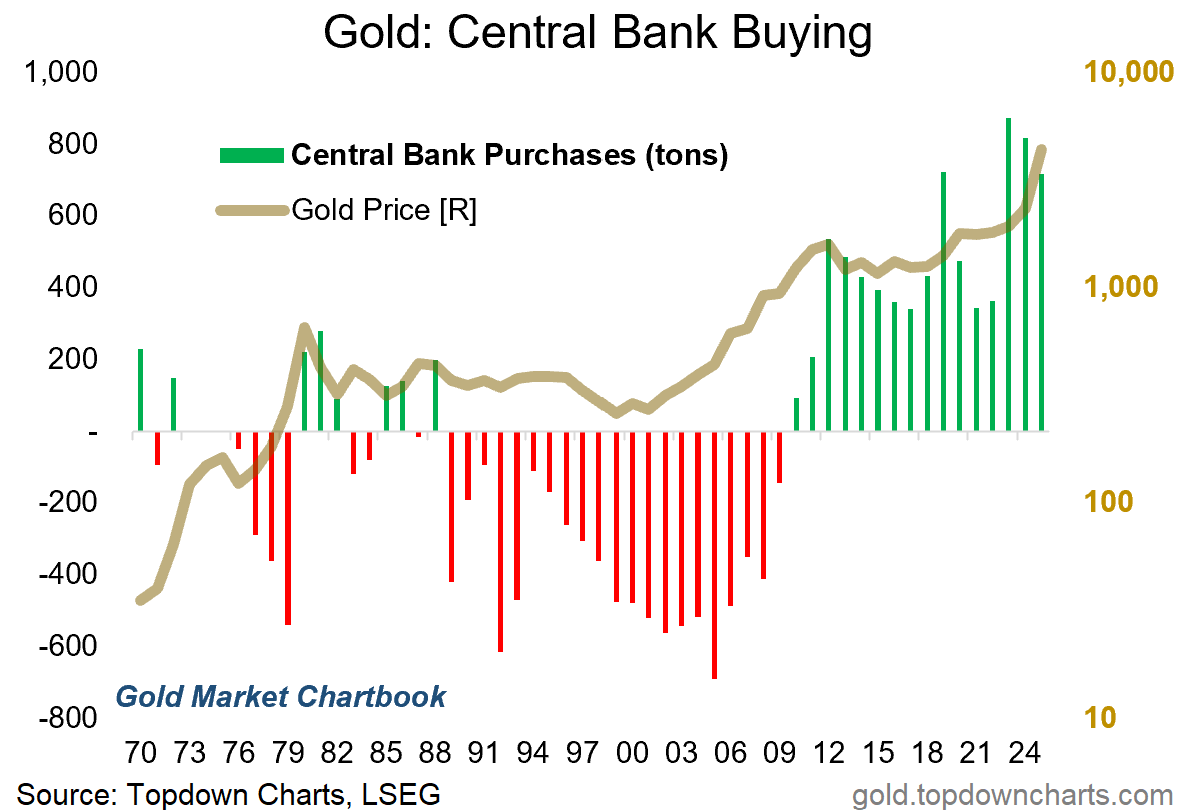
Central Bank Buying
Meanwhile, the big driver of this bull market continues to be central bank buying as the US government seemingly does all it can to discourage investors from wanting to invest in US dollars or US debt.
To be more specific, the risk to unfriendly governments of asset freezes makes gold a more attractive reserve asset, while ongoing policy uncertainty, shutdowns, and questions around fiscal sustainability has driven investors increasingly out of bonds and into gold.
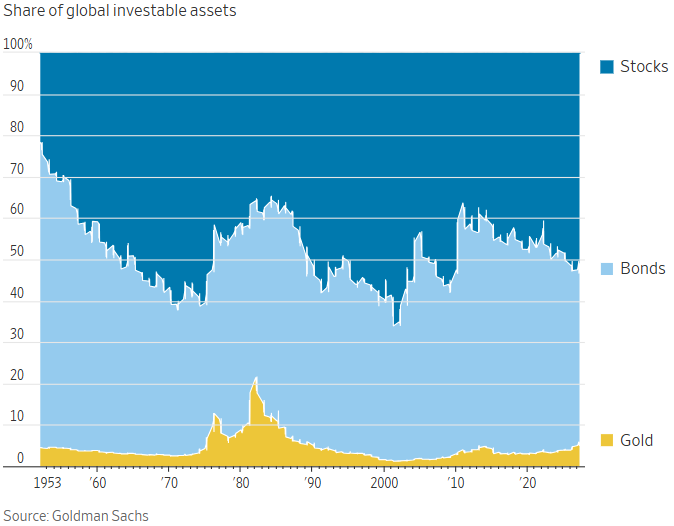
Gold Share vs Stocks & Bonds
And yet, as a share of the mainstream global investable assets, gold is still relatively small in the scheme of things: “Over the past 2 years, Gold has moved from 4% to 6% of global investable assets. That’s the highest share since 1986. During the 1980 Gold bubble it peaked at 22% of global investable assets. 20 years later (in 2000) it fell to just 1%.” (source)
From a signal standpoint this number is starting to get elevated, but the all-time historical peak reading of 22% goes to show it’s anyone’s guess as to how far things can go here.
Gold vs Stocks & Bonds
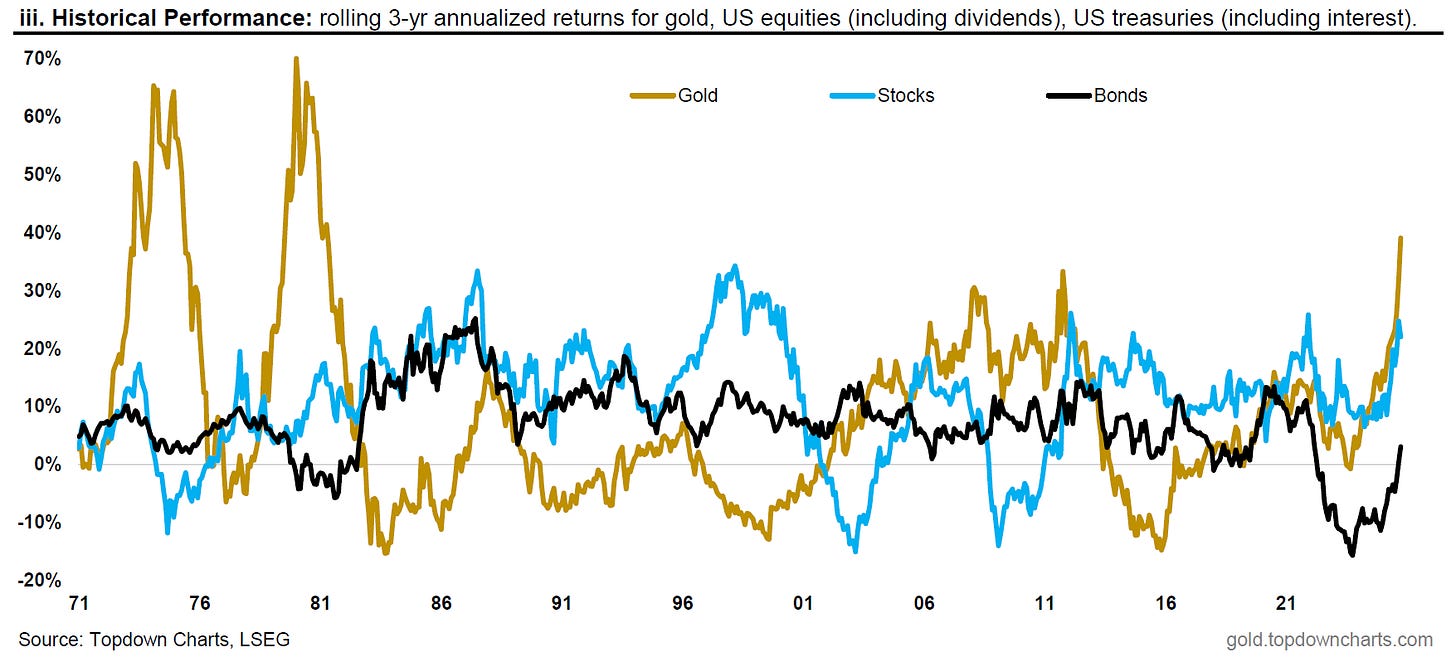
This last chart from the monthly pack provides some interesting perspective on gold vs stocks and bonds from an asset allocation perspective. As I’ve previously noted, it has previously made a lot of sense for investors to skew their defensive sleave into gold vs bonds, but equally the longer arc of history shows how this should be a dynamic as well as strategic decision [as I’ve said before: diversify your diversifiers (some gold, some bonds), and diversify dynamically (sometimes more gold, sometimes more bonds)].
It also goes to show the value of diversification in general as each of the three assets go through differing periods of boom and bust.
And as a final thought, the similarities between the current move (and inflationary shock aspect) to the 1970’s bull runs certainly makes one think…
This note was brought to you by the Monthly Gold Market Chartbook
Poll: what’s next for gold?
About the Monthly Gold Market Chartbook
The monthly Gold Market Chartbook is specifically designed to help busy investors quickly + easily understand the key drivers of risk vs opportunity in the gold market (and how it fits into traditional portfolios).
The pack includes over 70 charts, specialized indicators, and unique data, spanning:
Sentiment/Flows/Positioning (where are the pressures building up?)
Technicals, Global Gold Price (momentum, trend, divergences)
Long-term & Valuation Indicators (is gold overvalued?)
Gold Influences: Monetary & Macro (monetary tailwinds in play)
Gold Influences: Supply & Demand (supply vs demand outlook)
Gold Priced in other Currencies (what’s gold doing elsewhere?)
Gold Price Ratios (how is gold performing vs other assets?)
Asset Allocation Perspectives on Gold (how does gold fit in portfolios?)
Asset Watch: Stocks/Bonds/USD/Credit (risks vs opportunities in other major asset classes — and how that compares vs gold)
Silver Charts Section: sentiment, positioning, flows, valuations (i.e. how is the outlook for silver prices?)
NEW: Gold Miners: valuations, flows, allocations, fundamentals (i.e. what’s the risk/return setup for Gold Mining stocks?)
NEW: Other Precious Metals (Platinum & Palladium charts)
Act Now — (if you’re not already a subscriber), sign up to get instant access to the latest chartbook + archives; level-up your understanding and visibility on the key risks & opportunities in gold and precious metals investing.
If you have any questions/suggestions about the material or requests, simply get in touch via the website, we’d love to hear your thoughts.
Best wishes,
Callum Thomas
Head of Research & Founder
Topdown Charts | www.topdowncharts.com
LinkedIn: https://www.linkedin.com/in/callum-thomas-4990063/
NEW: Other services by Topdown Charts
Topdown Charts Entry-Level — [TD entry-level service]
Topdown Charts Professional — [institutional service]
Weekly S&P 500 ChartStorm —[US Equities in focus]
Monthly Gold Market Pack — [Gold charts]
Australian Market Valuation Book —[Aussie markets]


