GoldNuggets — Trends, Cycles, Metals
GoldNuggets Digest: long-term trend, gold market valuations, the precious-base metal procession, industrial metals, commodities (and emerging markets)
The GoldNuggets Digest is our weekly publication. It contains “nuggets” of Charts & Research on gold, commodities, and macro —issues and insights which we think will be interesting and useful for investors.
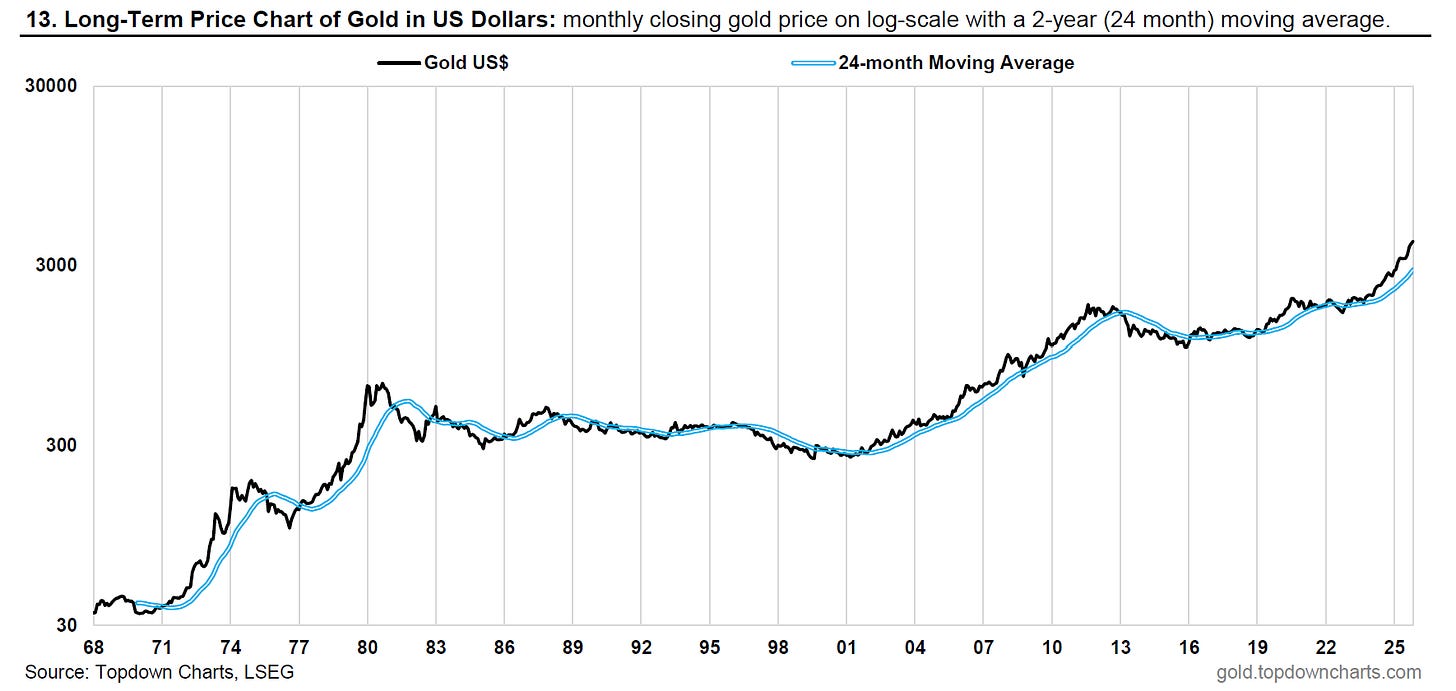
Gold — Long-Term Trend
Zooming out to the big picture, the trend is still your friend for gold. (source)
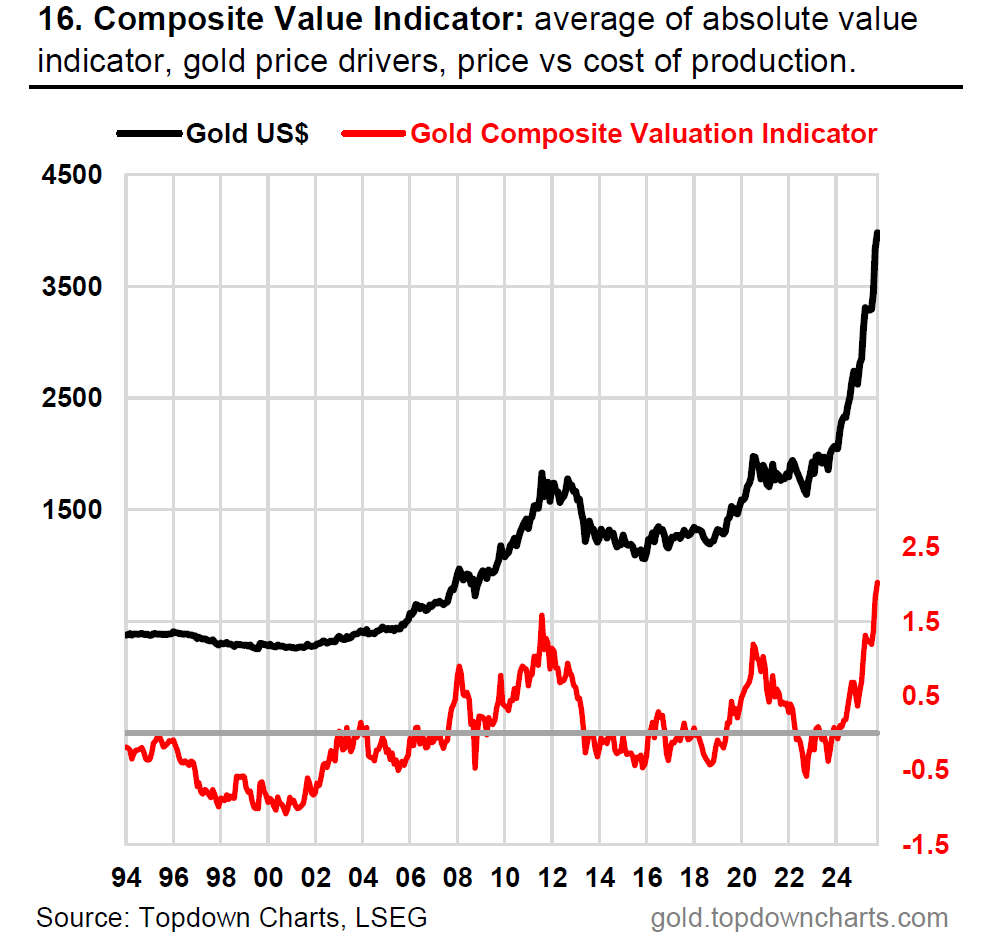
Gold Valuation Indicator
While the trend is still strong and up, investor allocations still have room to rise, and monetary tailwinds are still significantly supportive, the composite gold valuation indicator is in extreme expensive territory. (source)
History tells us expensive markets can get more expensive, but it also warns that periods of correction and consolidation are on the horizon.
See also: Gold Valuation Indicators in Focus (indicator methodology)
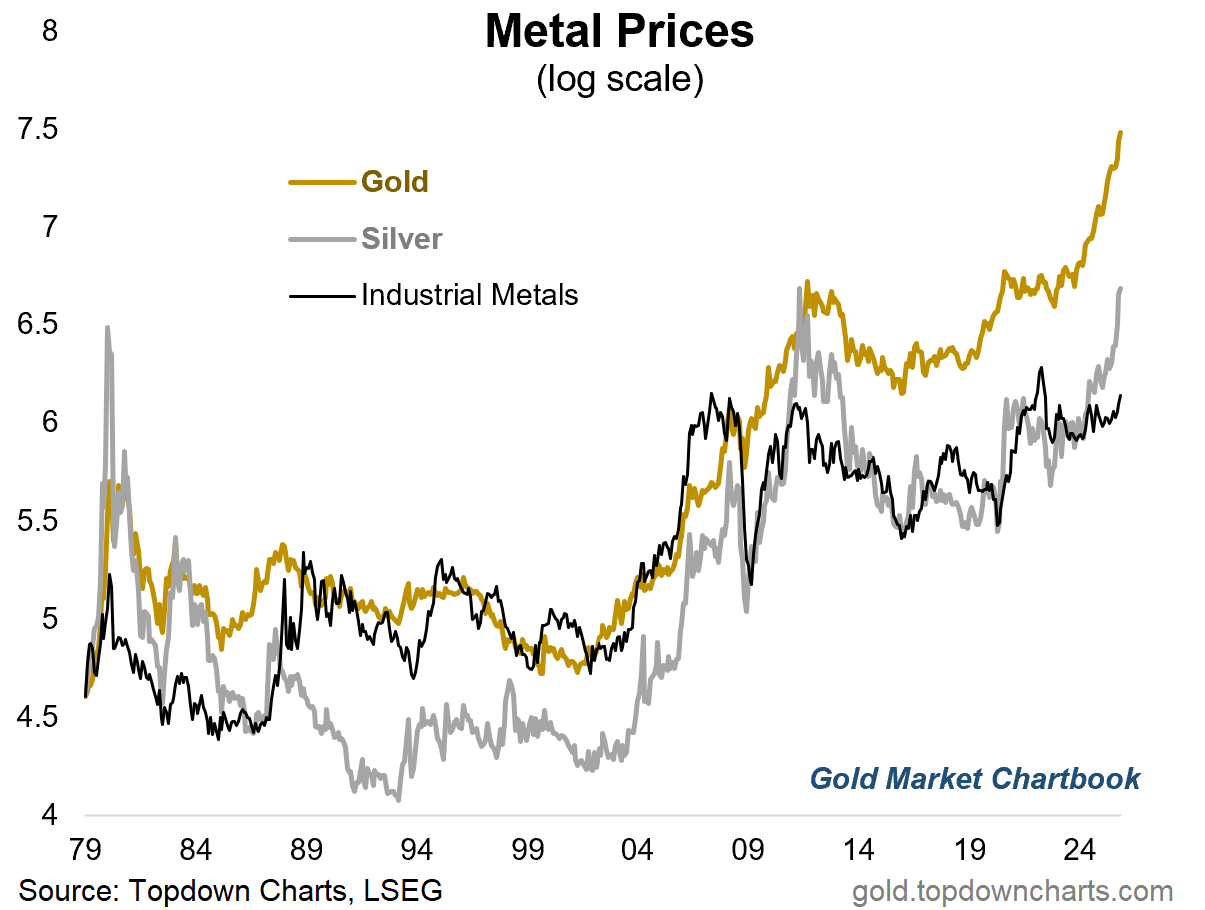
Gold vs Silver vs Base Metals
I continue to think this is one of the most important charts in commodities and certainly at least for metals. The procession of price leadership from monetary metals like gold to monetary-industrial hybrid metals like silver, and then to industrial metals (e.g. copper, aluminum, zinc) is a force set in motion here.
There are several tailwinds building behind base metals, and a breakout is in progress.
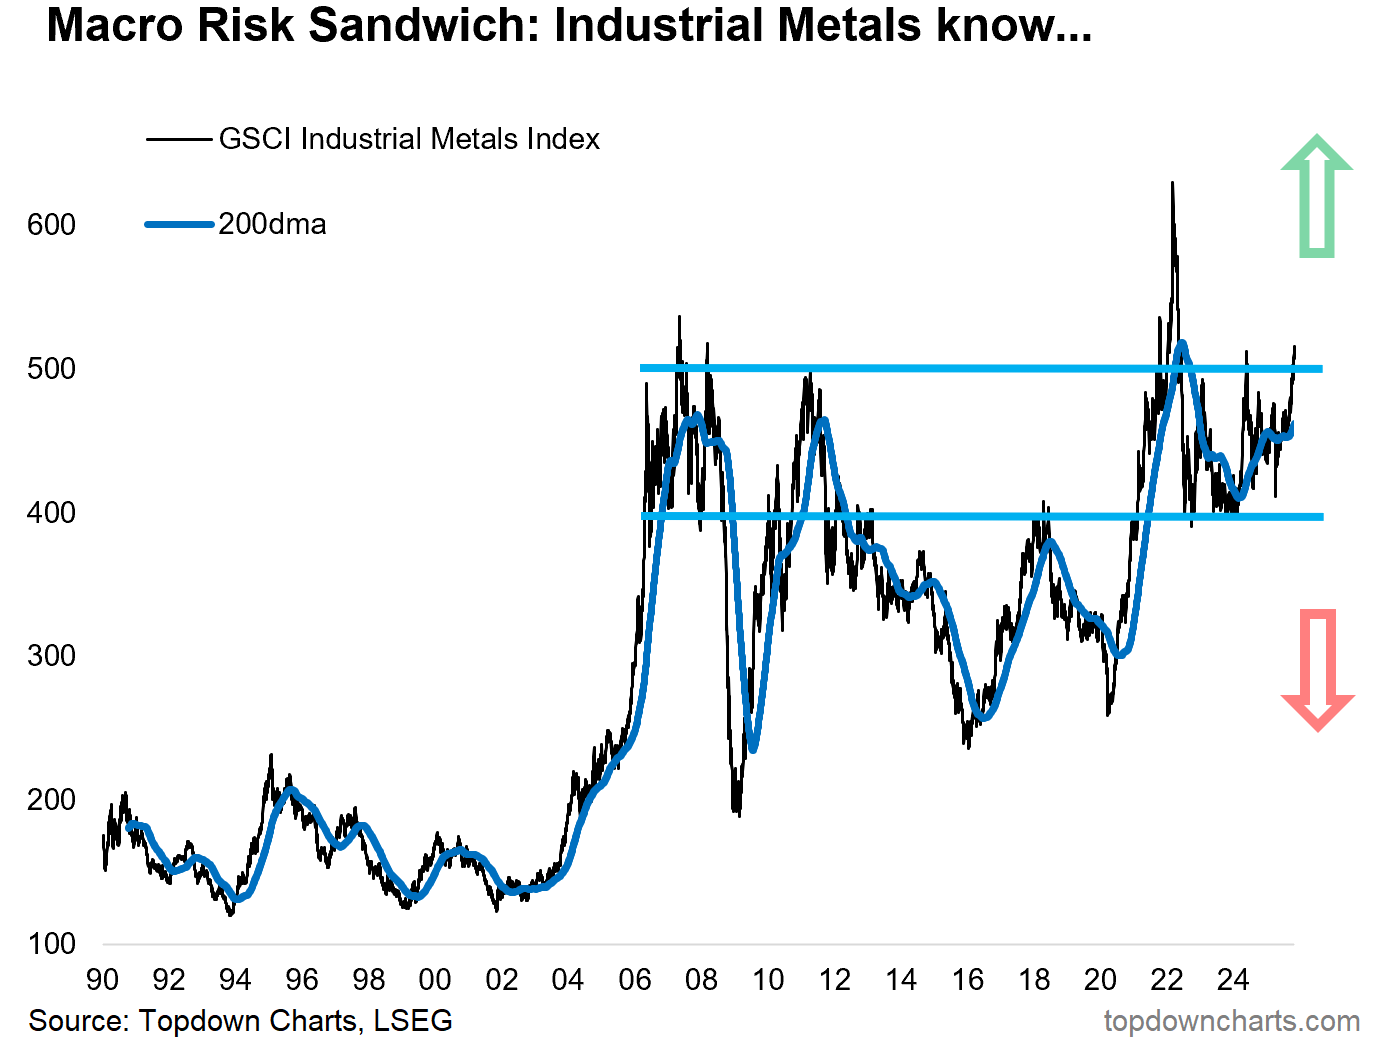
Industrial Metals
One key element in the cyclical outlook for industrial metals is the “global growth reacceleration“ theme, which I outlined last week — basically it looks like global growth is set to heat up in 2026. (source)
With industrial metals very much sensitive to the ebb and flow in the global economic growth pulse, I believe this is going to be a key barometer market too (helpful in tracking that macro theme).
And so when you see industrial metals breaking out like this it says as much about the opportunity in metals as it does about the macro outlook.
Commodities (and Emerging Markets)
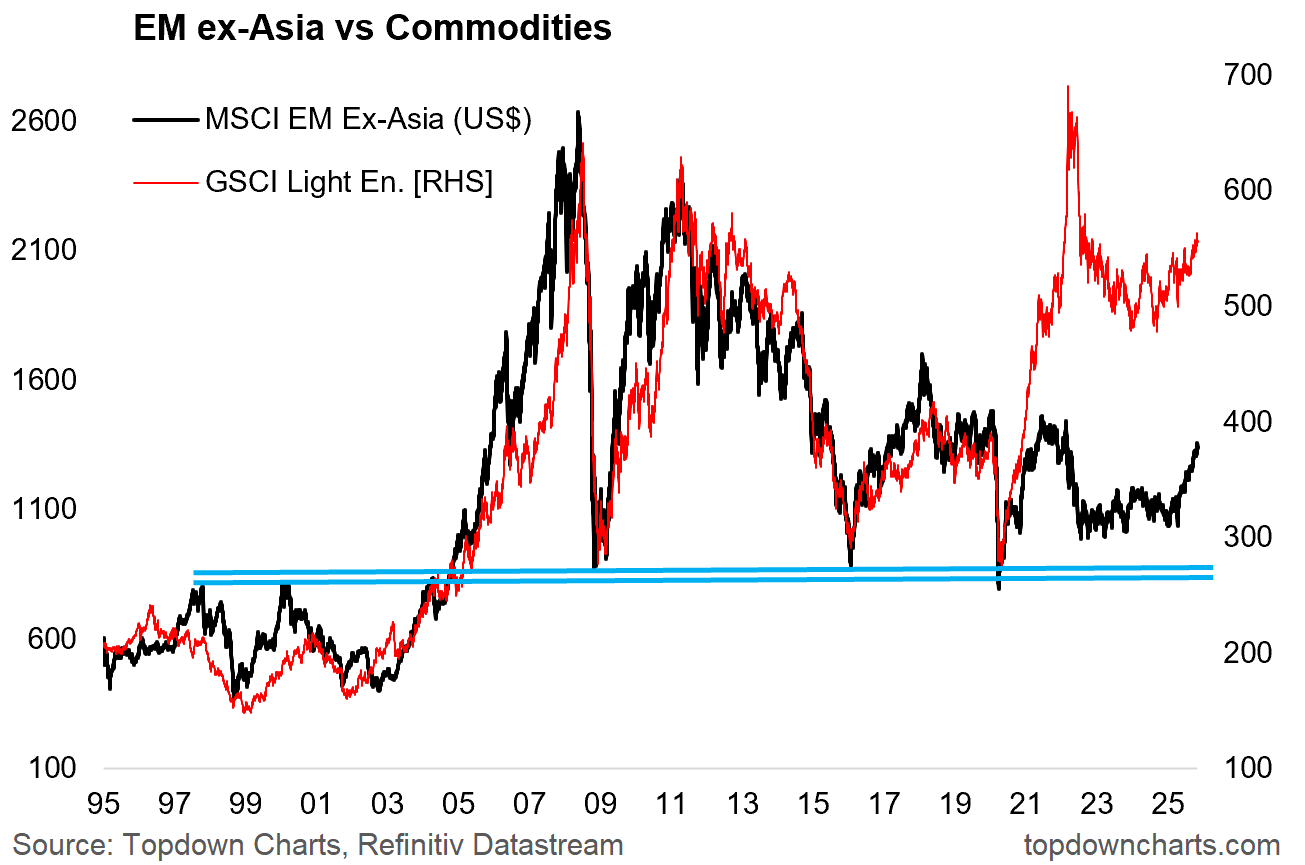
On a similar note, here’s a chart from my global cross-asset market monitor report — the key highlight being the emerging bull market in emerging market equities (notably in EM ex-Asia; which are generally more sensitive to commodity prices). (source)
And then set that alongside the bullish bottoming process on display in commodities (using the relatively diversified GSCI light energy index here), and it’s both confirmation of the previous chart and themes + further prompt to consider the bullish picture emerging in these still kind of out-of-fashion markets (everyone is focused on US big tech and missing what’s happening here).
This note was brought to you by the Monthly Gold Market Chartbook
About the Monthly Gold Market Chartbook
The monthly Gold Market Chartbook is specifically designed to help busy investors quickly + easily understand the key drivers of risk vs opportunity in the gold market (and how it fits into traditional portfolios).
The pack includes over 70 charts, specialized indicators, and unique data, spanning:
Sentiment/Flows/Positioning (where are the pressures building up?)
Technicals, Global Gold Price (momentum, trend, divergences)
Long-term & Valuation Indicators (is gold overvalued?)
Gold Influences: Monetary & Macro (monetary tailwinds in play)
Gold Influences: Supply & Demand (supply vs demand outlook)
Gold Priced in other Currencies (what’s gold doing elsewhere?)
Gold Price Ratios (how is gold performing vs other assets?)
Asset Allocation Perspectives on Gold (how does gold fit in portfolios?)
Asset Watch: Stocks/Bonds/USD/Credit (risks vs opportunities in other major asset classes — and how that compares vs gold)
Silver Charts Section: sentiment, positioning, flows, valuations (i.e. how is the outlook for silver prices?)
NEW: Gold Miners: valuations, flows, allocations, fundamentals (i.e. what’s the risk/return setup for Gold Mining stocks?)
NEW: Other Precious Metals (Platinum & Palladium charts)
Act Now — (if you’re not already a subscriber), sign up to get instant access to the latest chartbook + archives; level-up your understanding and visibility on the key risks & opportunities in gold and precious metals investing.
If you have any questions/suggestions about the material or requests, simply get in touch via the website, we’d love to hear your thoughts.
Best wishes,
Callum Thomas
Head of Research & Founder
Topdown Charts | www.topdowncharts.com
LinkedIn: https://www.linkedin.com/in/callum-thomas-4990063/
NEW: Other services by Topdown Charts
Topdown Charts Entry-Level — [TD entry-level service]
Topdown Charts Professional — [institutional service]
Weekly S&P 500 ChartStorm —[US Equities in focus]
Monthly Gold Market Pack — [Gold charts]
Australian Market Valuation Book —[Aussie markets]


The gold to silver to base metals procession you're tracking is probably the cleanest roadmap for where capital flows next in this cycle. That industrial metals breakout alongside your global growth reacceleration call for 2026 sets up a pretty compelling case for copper and alum plays. The valuation extreme warning is noted but with central banks still buying and most retail allocations still under 2% this feels like mid cycle territory not a top.
I see you are speaking at the New Orleans Resource Conference, I’m hoping to hear your talk, virtually, if the technology permits! Thanks for the work you do.
William