
GoldNuggets — Commodities in Focus
GoldNuggets Digest: commodities vs gold, valuation indicators, commodity fund flows, commodity technicals, macro monetary tailwinds...

The GoldNuggets Digest is our weekly publication. It contains “nuggets” of Charts & Research on gold, commodities, and macro —issues and insights which we think will be interesting and useful for investors.
In case you missed it: Gold Market Chartbook - November 2025 (click through to check out the just-released latest monthly chart pack)
Golden Harbinger for Commodities
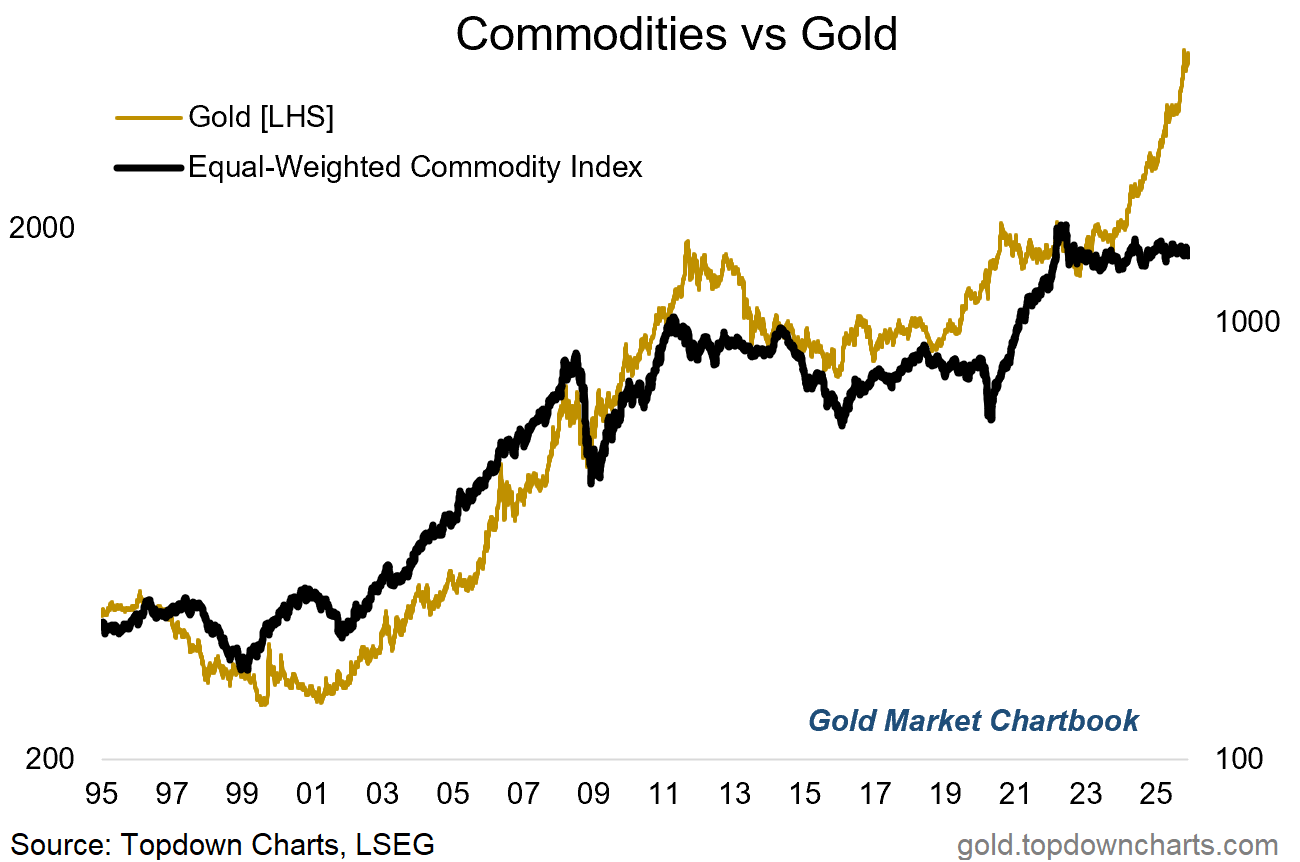
While gold has more than doubled over the past couple of years, the rest of commodities have been stuck in a trading range.
To the extent that some degree of the gold bull market reflects monetary easing and currency debasement, the logic of catch-up is one of monetary commodities (like gold) leading the charge and real-world activity-linked commodities playing catch-up later (just like what happened in 2020-22).
Valuation Indicators — Commodities vs Gold
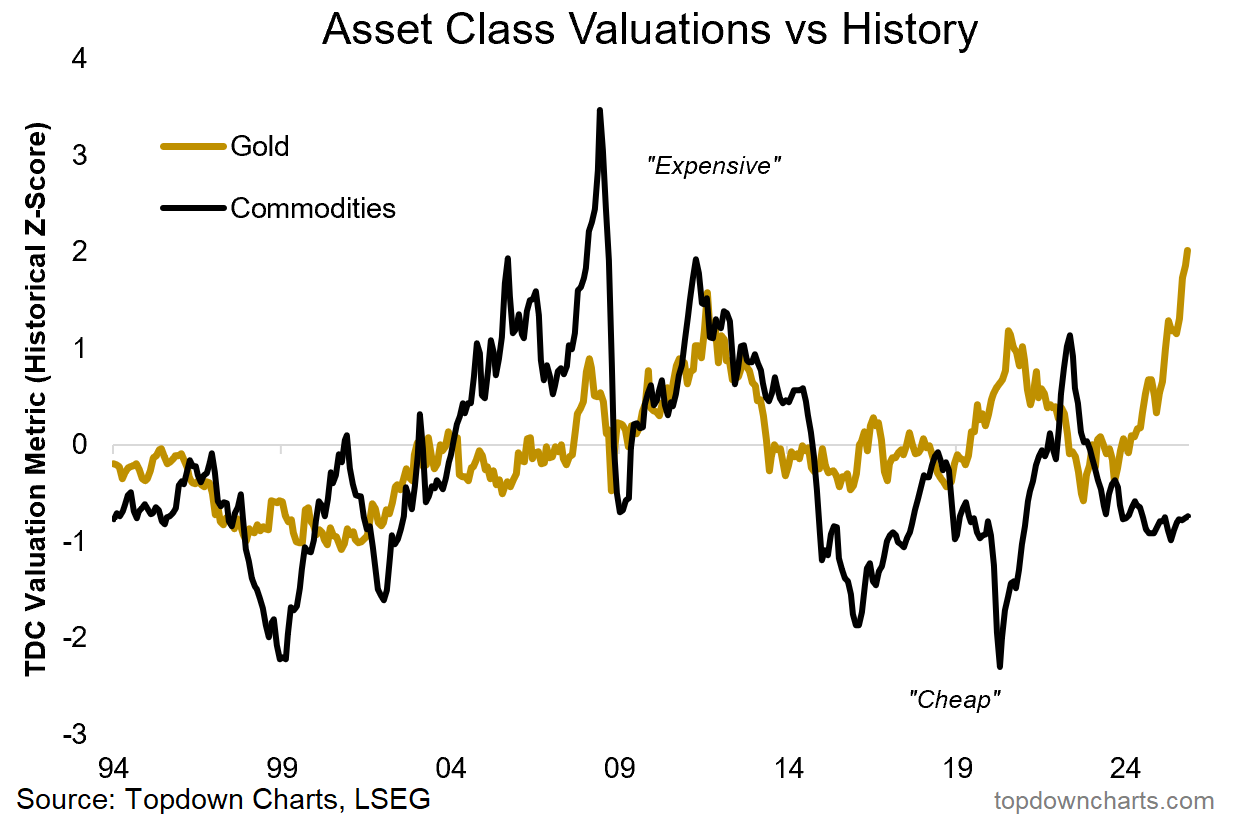
One key clue for possible gold-commodity rotation or even just commodity catch-up is where the valuation indicators are sitting for gold vs commodities.
Gold looks expensive, while commodities look cheap.
Whether it ends up being rotation (e.g. gold stumbles while commodities surge) or catch-up (gold stays steady or continues to climb, and the rest of commodities join the party) remains to be seen, but this chart definitely presents a bright picture for commodities.
Commodity Fund Flows
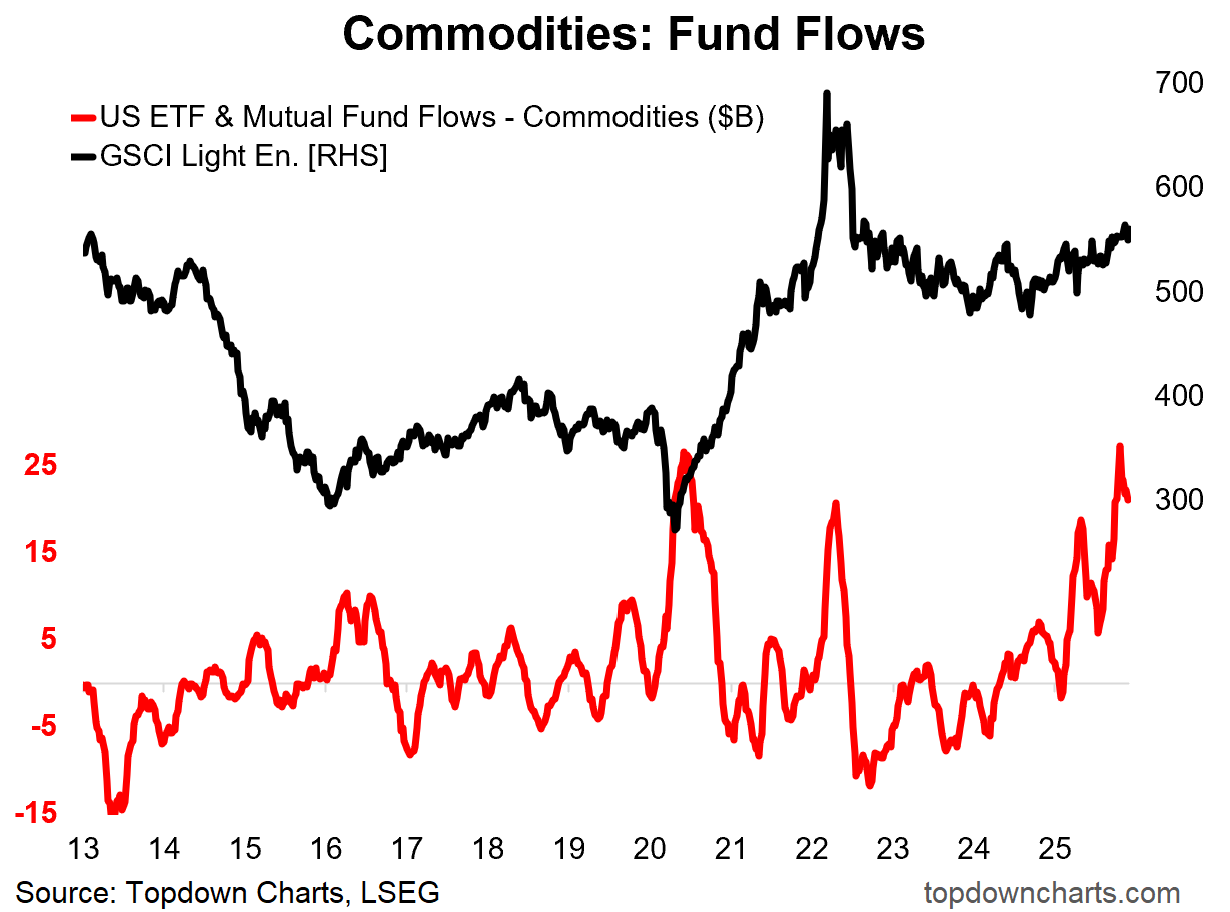
One interesting development on this front is the surge in commodity fund flows, which might be a sign commodities are set to breakout.
We saw similar surge when commodities turned up from the 2020 crash lows, again into the 2022 blow-off top, and also earlier back in 2015/16 when commodities started basing after the Supercycle bust.
Commodity Technicals
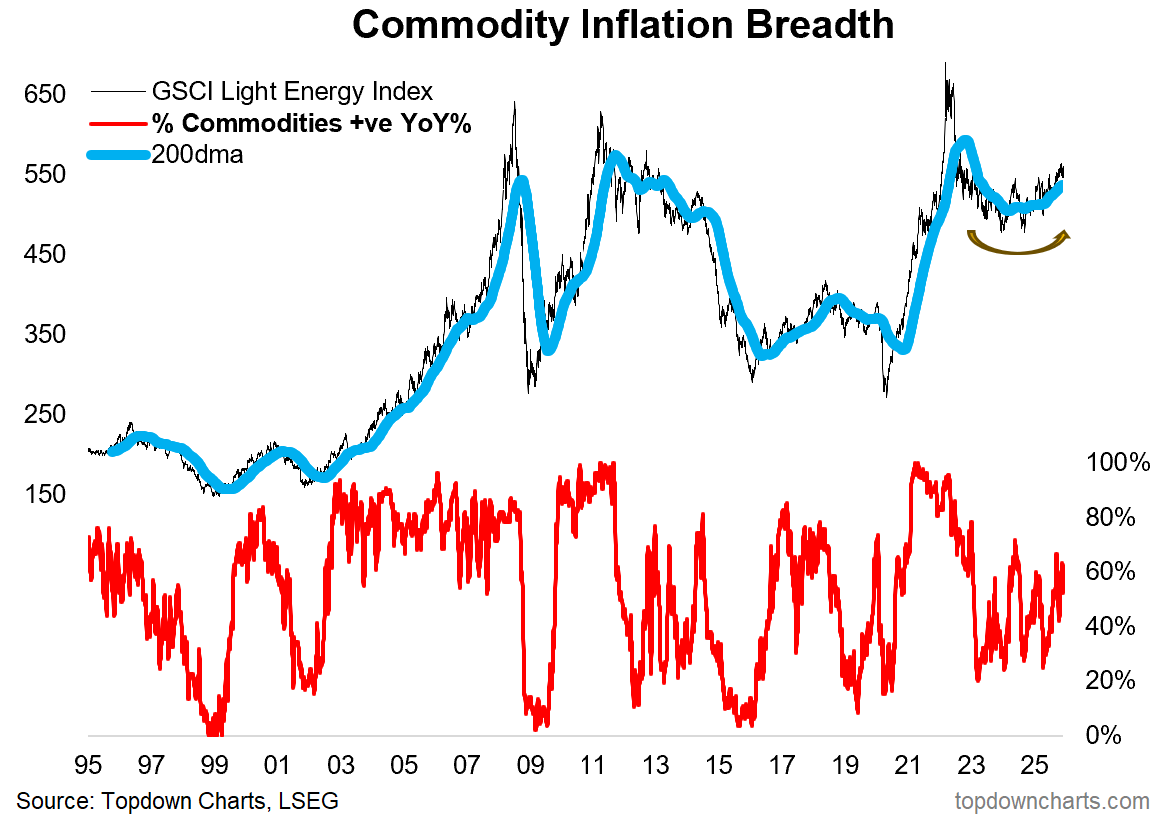
On the technical analysis front, zooming out — the GSCI Light Energy Index’s 200-day moving average is turning up out of cyclical bear market and I would argue into an emerging cyclical bull market.
Breadth is turning up again too, but to really gain conviction on this we ideally want to see breadth basically break out of this range and push higher. So that (along with the index itself) is a key variable to keep tabs on.
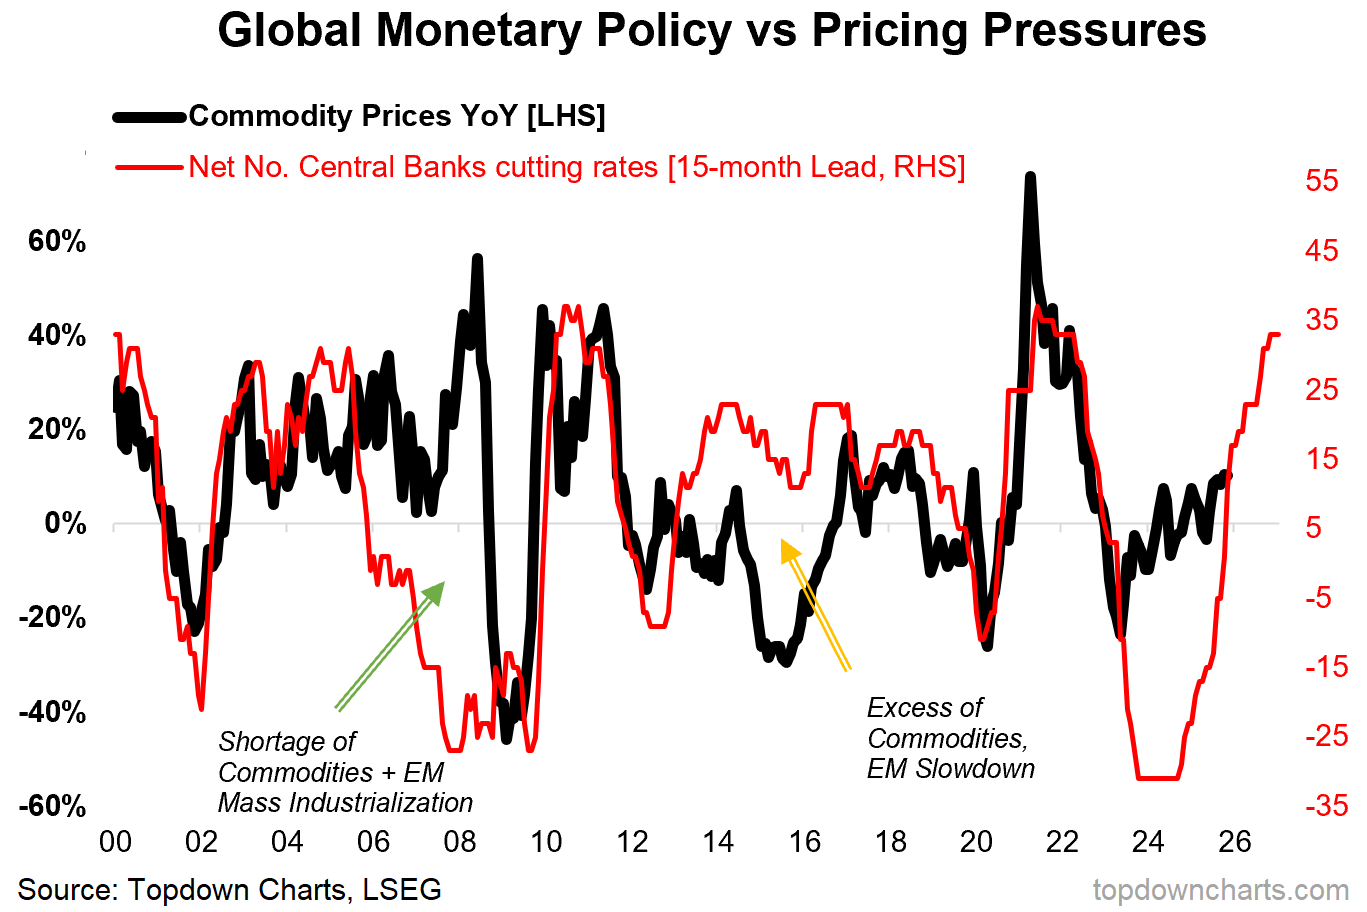
Macro — Monetary Tailwinds
Lastly, as I highlighted in my 2026 Big Ideas webinar, we’ve seen a significant build-up in monetary tailwinds, and this is likely to contribute to a global economic reacceleration into 2026 (and resurgence in inflation — aka commodities upside).
So overall for commodities it’s a situation of undervalued, improving technicals, and monetary/macro tailwinds. Hence why I have been bullish on commodities at the asset class (aggregate) level.
SURVEY — do you want more coverage of commodities in general?
(…or just stick to gold, precious metals, miners?)
Subscribe for more resources by the Monthly Gold Market Chartbook
About the Monthly Gold Market Chartbook
The monthly Gold Market Chartbook is specifically designed to help busy investors quickly + easily understand the key drivers of risk vs opportunity in the gold market (and how it fits into traditional portfolios).
The pack includes over 70 charts, specialized indicators, and unique data, spanning:
Sentiment/Flows/Positioning (where are the pressures building up?)
Technicals, Global Gold Price (momentum, trend, divergences)
Long-term & Valuation Indicators (is gold overvalued?)
Gold Influences: Monetary & Macro (monetary tailwinds in play)
Gold Influences: Supply & Demand (supply vs demand outlook)
Gold Priced in other Currencies (what’s gold doing elsewhere?)
Gold Price Ratios (how is gold performing vs other assets?)
Asset Allocation Perspectives on Gold (how does gold fit in portfolios?)
Asset Watch: Stocks/Bonds/USD/Credit (risks vs opportunities in other major asset classes — and how that compares vs gold)
Silver Charts Section: sentiment, positioning, flows, valuations (i.e. how is the outlook for silver prices?)
NEW: Gold Miners: valuations, flows, allocations, fundamentals (i.e. what’s the risk/return setup for Gold Mining stocks?)
NEW: Other Precious Metals (Platinum & Palladium charts)
Act Now — (if you’re not already a subscriber), sign up to get instant access to the latest chartbook + archives; level-up your understanding and visibility on the key risks & opportunities in gold and precious metals investing.
If you have any questions/suggestions about the material or requests, simply get in touch via the website, we’d love to hear your thoughts.
Best wishes,
Callum Thomas
Head of Research & Founder
Topdown Charts | www.topdowncharts.com
LinkedIn: https://www.linkedin.com/in/callum-thomas-4990063/
NEW: Other services by Topdown Charts
Topdown Charts Professional — [institutional Macro/AA research service]
Topdown Charts Entry-Level — [entry-level version of the above]
Weekly S&P 500 ChartStorm —[US Equities in focus]
Monthly Gold Market Pack — [Gold charts]
Australian Market Valuation Book —[Aussie markets]
Uranium and other metals would be great. Its would be a perfect bundle with gold/silver/copper/platinum/pladium/uranium.